Metals Dash Higher After SCOTUS Strikes Down Trump’s Tariffs
The precious metals complex ended the week with a solid rally after the Supreme Court of the US (SCOTUS) ruled 6 to 3 that the Trump administration’s method of imposing tariffs was beyond his authority without congressional approval.
Predictably, the White House responded to the announcement with blithe indifference, viewing the 80-page ruling as more a judicial hurdle than an obstruction to Mr. Trump’s current international trade policy.
In other words, the SCOTUS only struck down the circumvention of congress to impose tariffs, not the tariffs themselves.
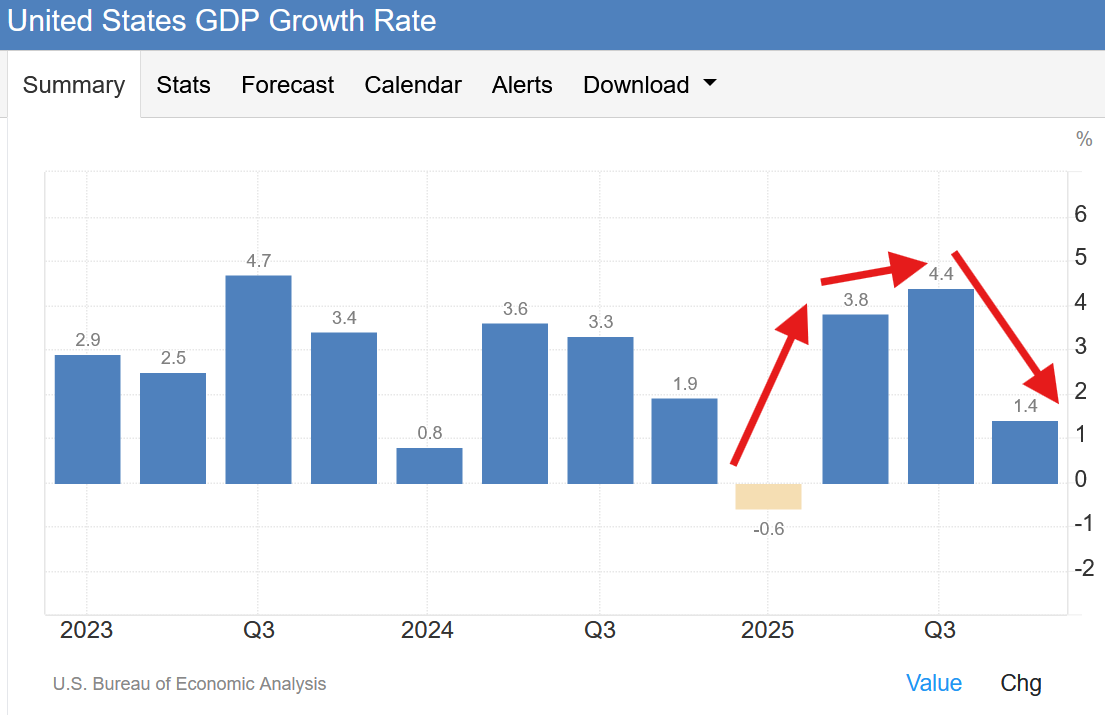
Separately, as illustrated on Chart 1, the sharp drop in Q4 GDP suggests another rate cut is “in play” for the March 18th FOMC meeting, which is bullish for Gold, Silver and Platinum.
Physical Gold priced in USD posted its highest weekly close ever at $5105.00 and was 5.7% higher for the week.
USD Gold has now closed above its 30-Day Moving Average (30-DMA) every day since November 21st, which is a very bullish chart structure for long-term investors.
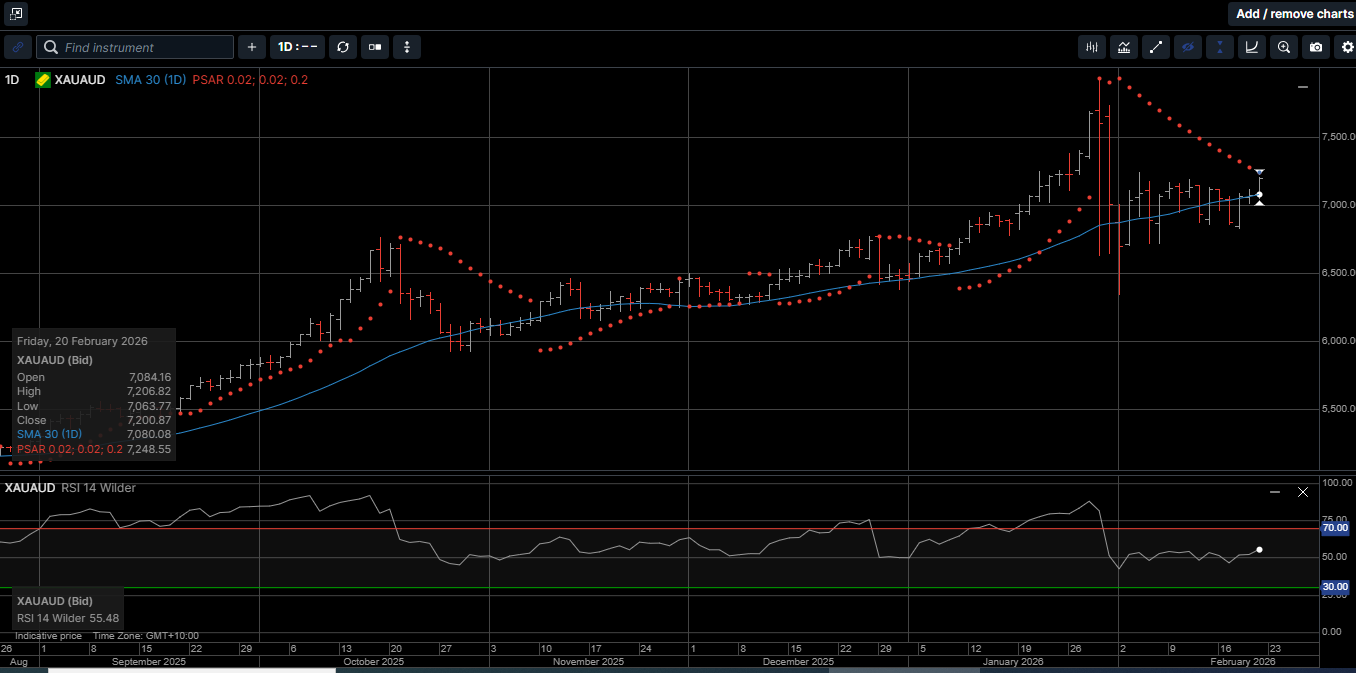
Gold denominated in AUD reached a one-month high of $7208.00 and finished the week 1.1% higher at $7200.00.
Gold in both currencies closed out last week near the weekly high prices, which suggests a bullish start to the new week.
Physical Silver priced in USD picked up 9.5% for the week, which included a 7.7% gain during Friday’s trading session. The close at $84.60 now targets initial chart resistance at $88.50, which is the 30-DMA.
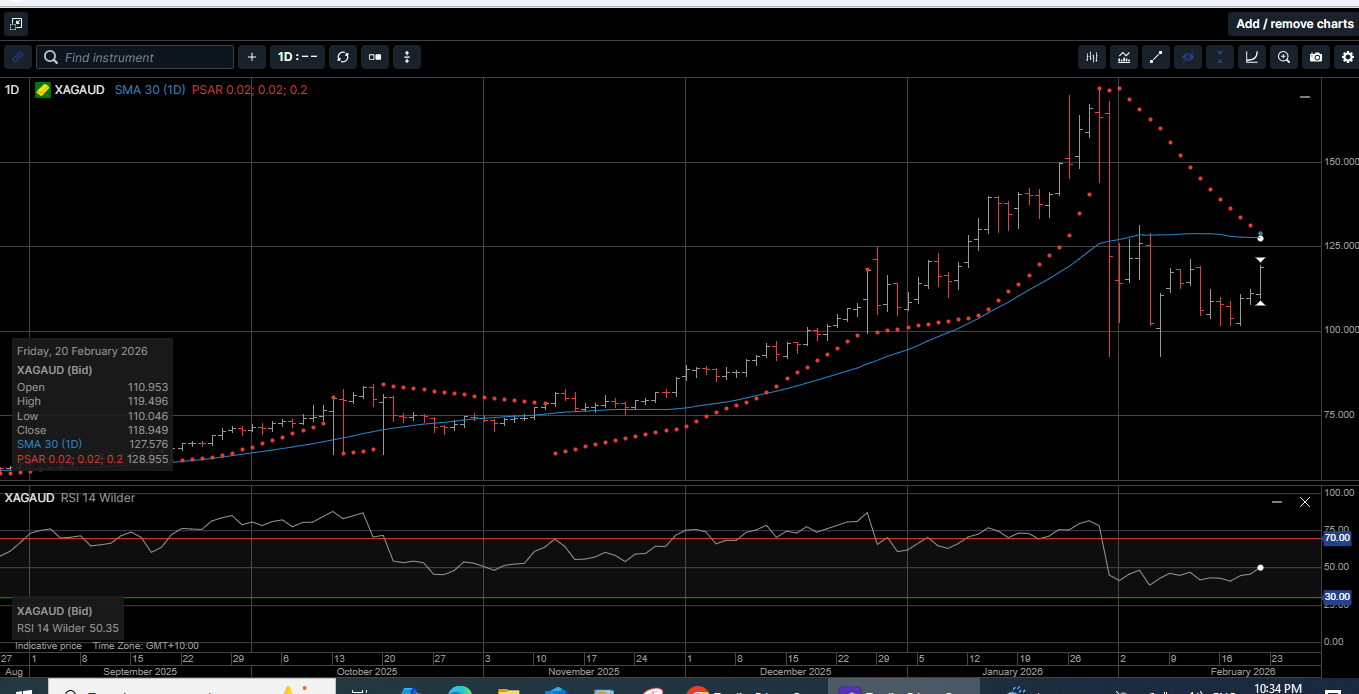
Silver denominated in AUD hit a three-week high at $119.50 before slipping lower to finish the week 9.3% higher at $118.95. The 30-DMA at $127.50 looks out of reach for this week, but the technical tone continues to improve.
The Gold versus Silver ratio dropped 7.9% in favor of Silver last week to close at 60.07, this means it takes 60.07 ounces of Silver to equal the price of one ounce of Gold.
We are currently in the middle of the 80/50 rule discussed in last week’s newsletter but we expect see a slight upward bias in favor of Gold over the near term.
Physical Platinum has traded higher in five of the last six trading sessions and closed out the week 4.3% higher at $2146.00. The price action suggests that Platinum is building upside momentum within a broad flag pattern bound by $2335 and $1820.
A daily close above the 30-DMA at $2287.00 would suggest a durable low below $1900.00 is in place.
Over the last 18 months, there have been very few assets that have outperformed Gold, Silver and Platinum.
With that in mind, it’s not surprising to hear a growing number of market commentators discuss various strategies of scaling out of stocks and adding to hard assets.
For decades, the Dow Jones Industrial Average has been promoted as the ultimate benchmark for long-term investing success. Analysts and financial media regularly praise its performance, often portraying the Dow-30 as the premier wealth-building vehicle.
But there’s a catch: unlike Gold, Silver and Platinum the Dow 30 Index is not a constant.
Over the past 50 years, underperforming companies in the Dow Jones 30 Index have been removed and replaced more than 60 times to maintain its upward trajectory.
This constant reshuffling ensures the Dow always reflects a select group of popular businesses, making it seem like an unbeatable long-term investment.
However, unlike the Dow 30, hard assets don’t change.
Gold, Silver and Platinum have been a store of value for thousands of years, immune to corporate failures, economic shifts, and index rebalancing schemes.
Yet, despite all the noise about the Dow’s strength, physical Gold has actually performed just as well, if not better, over the past 100 years.
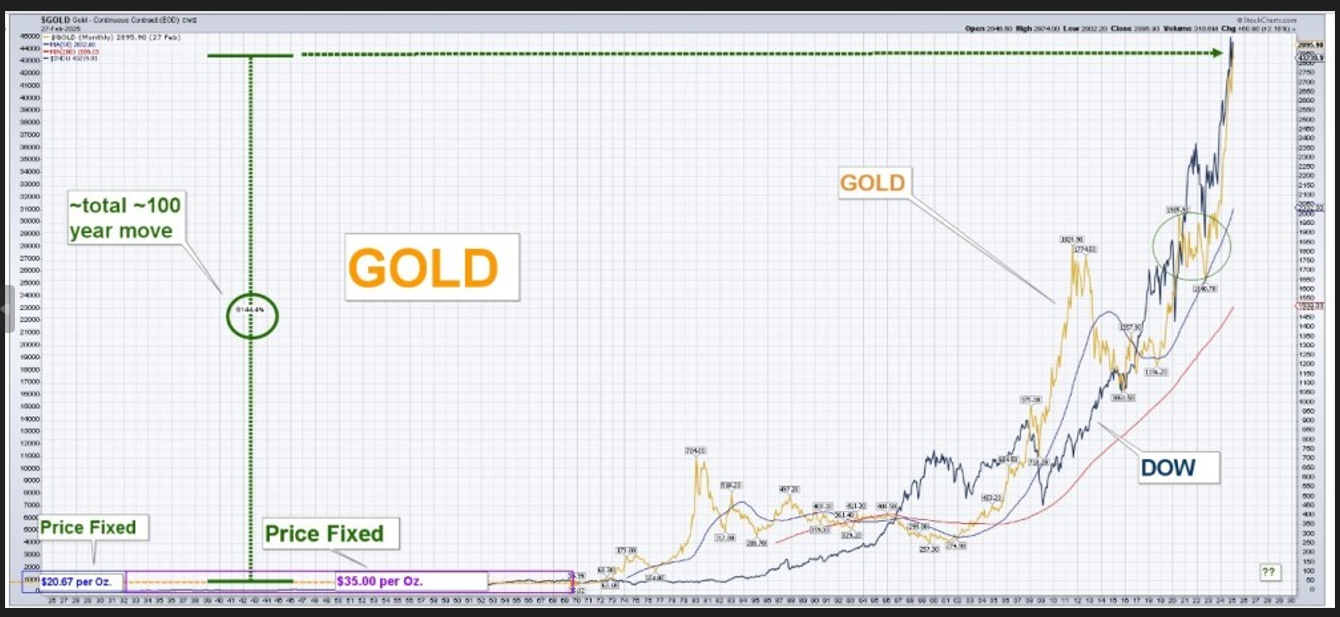
Chart 2 shows a remarkable reality: Gold has kept pace with the Dow over the long run despite being dismissed as a non-yielding asset by some in mainstream finance.
Look at the comparative valuations between the Dow 30 and Gold from a recent time perspective.
At the beginning of 2000, the Dow 30 Index was at 11,500 and the price of one ounce of Gold was $290.00. That means the Dow was priced at almost 40 times the price of one ounce Gold.
By the beginning of 2025, the Dow 30 was at 42,875 and one ounce of Gold was $2625. That means the Dow was worth 16 ounces of Gold.
As of last Friday, the Dow 30 closed at 49,625 and one ounce of Gold closed at $5105.00. That means the Dow 30 is now priced at less than 10 times the price of one ounce of Gold.
The Dow/Gold ratio has moved from 40 to 1 in 2000, to 16 to 1 at the beginning of 2025, to less than 10 to 1 now.
With that in mind, investors of all levels should consider this: If physical Gold has matched the performance of an ever-evolving stock index over the last 25 years, what happens when Gold’s true monetary role reasserts itself in an environment of extreme money printing, debt expansion, and de-dollarization?
With Gold, Silver and Platinum prices near record highs, long-term investors are seeing first hand how hard assets increase wealth as well as wealth security.
In fact, we may be entering a new market phase where Gold not only keeps pace with the Dow 30 but decisively outperforms it.
Now is the time to consider scaling out of non-performing paper assets and making Gold, Silver and Platinum the cornerstone assets of your long-term wealth creation strategy.
This publication has been prepared for the GBA Group Companies. It is for education purposes only and should not be considered either general of personal advice. It does not consider any particular person’s investment objectives, financial situation, or needs. Accordingly, no recommendation (expressed or implied) or other information contained in this report should be acted upon without the appropriateness of that information having regard to those factors. You should assess whether or not the information contained herein is appropriate to your individual financial circumstances and goals before making an investment decision or seek the help the of a licensed financial adviser. Performance is historical; performance may vary; past performance is not necessarily indicative of future performance. Any prices, quotes or statistics included have been obtained from sources deemed to be reliable, but we do not guarantee their accuracy or completeness.