Metals Are Mixed After “Hot” Inflation Data
Last week’s reports on US Consumer Price Inflation (CPI) and Producer Price Inflation (PPI) both printed higher than expected, which initially lifted bond yields and pressured the precious metals complex lower.
However, after Friday’s comments from FED Chief Kevin Warsh dampened rate hike expectations for next week’s FOMC meeting, hard assets pared losses and rose into the weekend.
On balance, we expect a pause on the FED Funds rates on October 28th will be a bullish fundamental signal for Gold, Silver and Platinum prices.
Physical Gold priced in USD traded within recent ranges and finished the week fractionally lower at $4164.00. The daily Relative Strength Index (RSI) reflects a neutral reading at 45.00.
Initial support is at the double bottom point at $4070.00, and resistance is near the 30-Day Moving Average (30-DMA) at $4241.00.
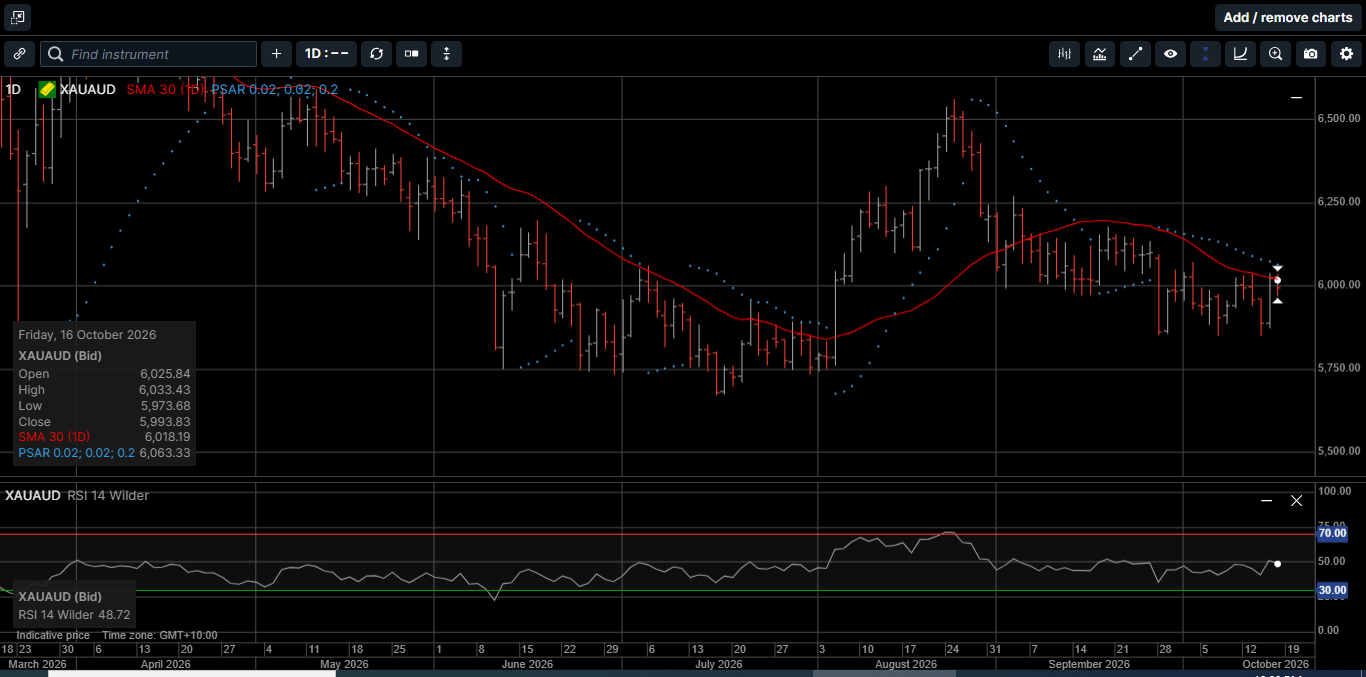
Gold denominated in AUD pushed the 30-DMA during three sessions last week before finishing unchanged at $5993.00. The daily RSI is flat just under 50.00.
Initial support is the triple bottom area near $5860.00, and resistance is in the $6050 to $6070.00 range.
Physical Silver priced in USD hit a three-month low at $55.38 last Wednesday before recovering to finish the week 6.3% lower at $56.95.
The daily RSI touched an oversold reading at 31.00. Initial support is just above $55.30, and resistance is $61.40.
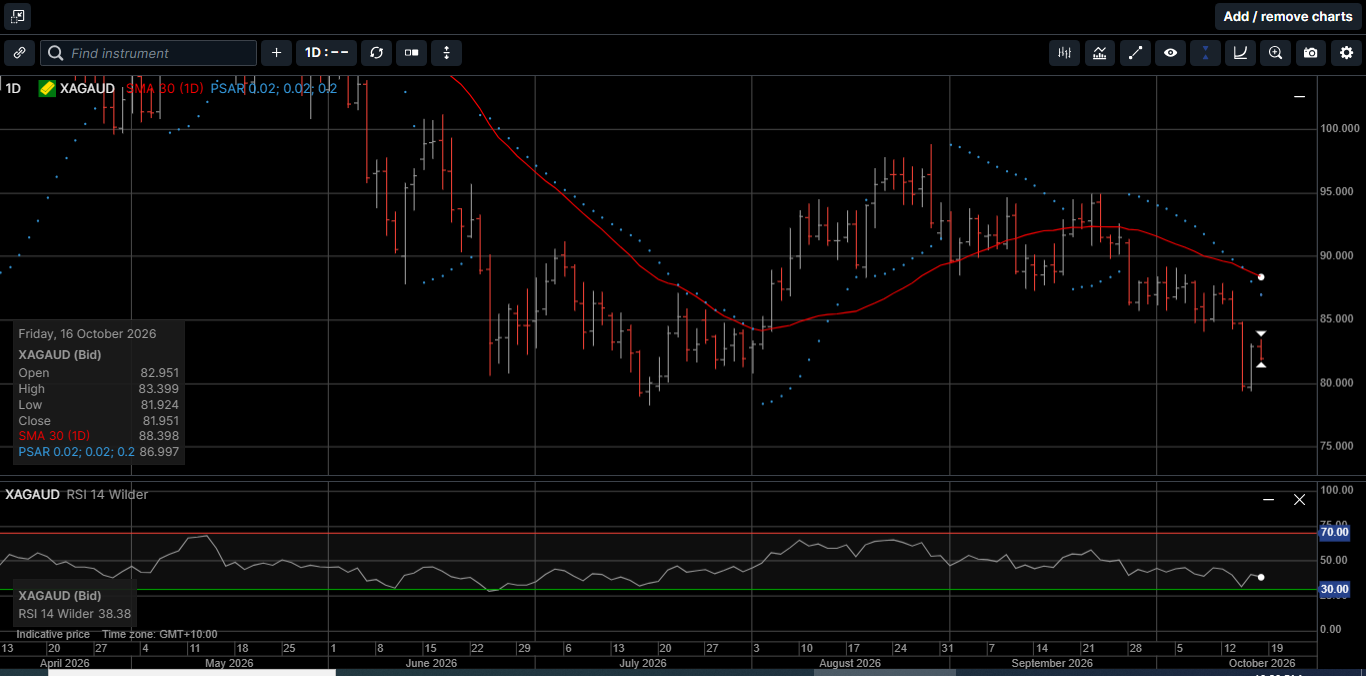
Silver denominated in AUD dipped to a three-month low at $79.50 and closed out the week 5.8% lower at $81.95. The daily RSI reflects a flat reading at 38.30.
Initial support is $79.25, and resistance is near the 30-DMA at $88.40.
The Gold verses Silver ratio rose 6.0% in favor of Gold to close at 73.00, which means it takes 73.00 ounces of Silver to equal the price of one ounce of Gold.
The ratio hit 74.25 last Thursday, which is the highest level since November of last year and a 50% retracement level from the April 2025 high at 107.25 and the low print of 42.10 in January of this year.
Physical Platinum touched a 10-week low at $1600 before recovering to close 3.3% lower at $1633.00. The daily RSI is 45.00 and pointing higher.
Initial support is $1580.00, and resistance is the near the 30-DMA at $1730.00.
Following the hotter US CPI print on Wednesday, the PPI accelerated significantly more than expected. Last month, US producer prices rose 1.3% compared to a 0.7% market consensus.
But after an initial spike higher, US Treasury yields slipped significantly lower into the weekend.
As illustrated on Chart 1, maybe investors found some comfort in the fact that most of the inflationary pressure remains concentrated in energy prices.
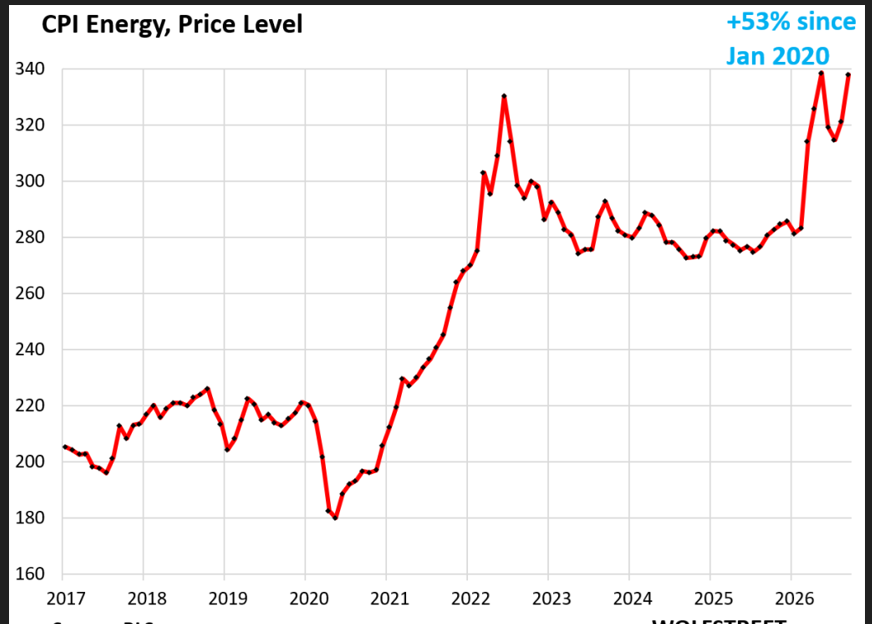
Or, perhaps, the PPI print underscored the pressure on US producers. If they are unable to pass higher energy costs on to consumers, margins should come under pressure.
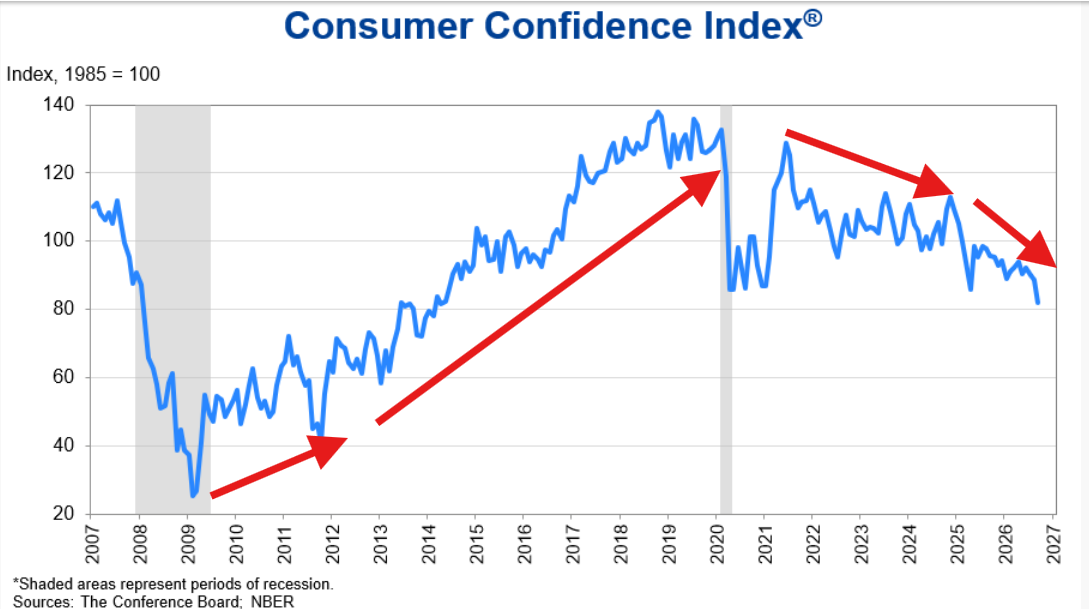
Last Thursday’s Retail Sales figures suggest that higher energy prices may be eroding some consumer demand, as well as consumer confidence.
In fact, as shown on Chart 2, the US Consumer Confidence Index has dropped to levels not seen since the COVID lockdowns back in 2020.
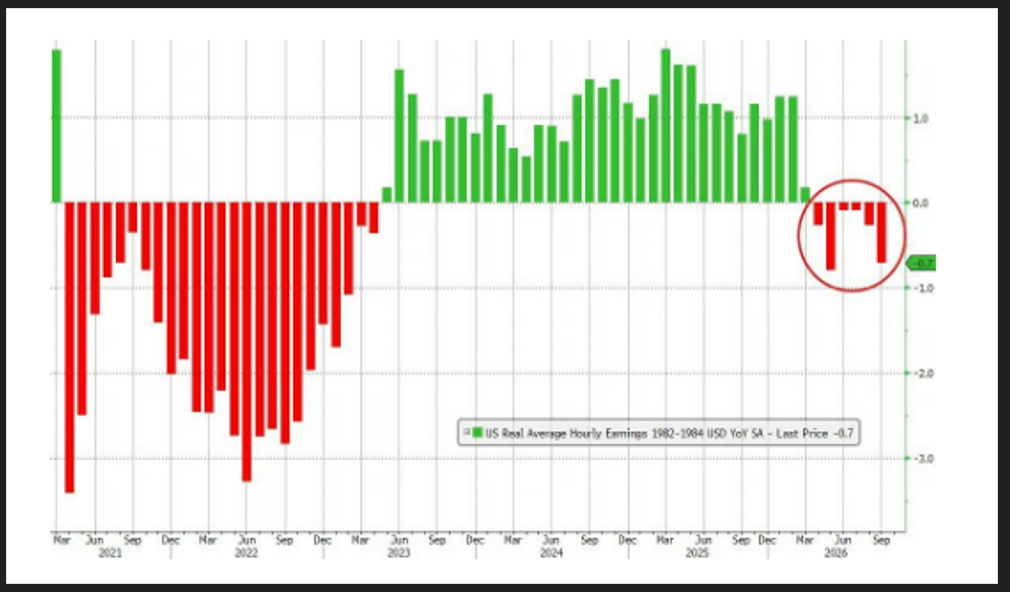
Another economic condition weighing on US consumer confidence has been the recent fall in wage growth.
As shown on Chart 3, Real Average Hourly Earnings in the US have steadily dropped over the last six months.
Further, the US fiscal year ended last month, and the final tally from the Office of Management and Budget offered another stark warning about the trajectory of US debt.
For example, US debt interest payments hit $3 billion per day and jumped 8% during fiscal 2026, which is faster than total federal spending, revenue, and GDP growth.
The net interest payments rose 8.3% to $1.05 trillion in fiscal 2026, while revenue increased 3% to $5.4 trillion and spending grew 6% to $7.4 trillion.
In short, in fiscal year 2026, the US government took in $5.4 trillion and spent $7.4 trillion.
Let that sink in for a moment.
During fiscal year 2026, the US government spent $7.4 trillion, more than $20 billion every day, and racked up an additional $2 trillion in debt, which requires over $3 billion per day just to repay the interest on the debt without even touching the principal of the debt.
Aside from the fact that the US Federal Reserve has never raised the FED Funds rate within a month of a federal election, last week’s softer high frequency economic data will likely keep the FOMC on hold, which should give the precious metals complex a boost.
From a longer-term perspective, Gold, Silver and Platinum have long been considered the purest forms of money with their value rising during times of geopolitical tension, economic uncertainty and fiscal profligacy.
Unlike fiat currencies, hard assets are not bound to any particular government or political system. This makes them less vulnerable to the direct effects of political decisions and credit market stress.
Throughout history, hard assets have provided a store of value and financial security. This track record gives investors great confidence in their ability to preserve wealth and purchasing power during turbulent times.
As such, now is the time prepare for the next bullish super cycle by adding to your holdings of physical Gold, Silver and Platinum.
As such, now is the time to consider adding to your hard asset holdings and making Gold, Silver and Platinum the cornerstone assets in your long-term wealth creation strategy.
This publication has been prepared for the GBA Group Companies. It is for education purposes only and should not be considered either general of personal advice. It does not consider any particular person’s investment objectives, financial situation, or needs. Accordingly, no recommendation (expressed or implied) or other information contained in this report should be acted upon without the appropriateness of that information having regard to those factors. You should assess whether or not the information contained herein is appropriate to your individual financial circumstances and goals before making an investment decision or seek the help the of a licensed financial adviser. Performance is historical; performance may vary; past performance is not necessarily indicative of future performance. Any prices, quotes or statistics included have been obtained from sources deemed to be reliable, but we do not guarantee their accuracy or completeness.