Markets Look Set For Allocation Rotation
Our assessment of the technical conditions and upcoming economic data appears to be aligning in a way that suggests asymmetrical upside potential in the precious metals complex.
The metals have largely range traded during the recent sharp rise in treasury yields.
With the forward markets pricing in a 60% chance of a rate hike next month, a few days ahead of the US Midterm elections, we suspect the rates pendulum is unlikely to swing much further, which is bullish for Gold, Silver and Platinum.
Physical Gold priced in USD spent the week below the 30-Day Moving Average (30-DMA) and slipped 2.1% lower to close out the week at $4285.00.
The daily Relative Strength Index (RSI) shows a neutral reading at 44.70. The double bottom at $4230 is initial support, and resistance is the 30-DMA at $4415.00.
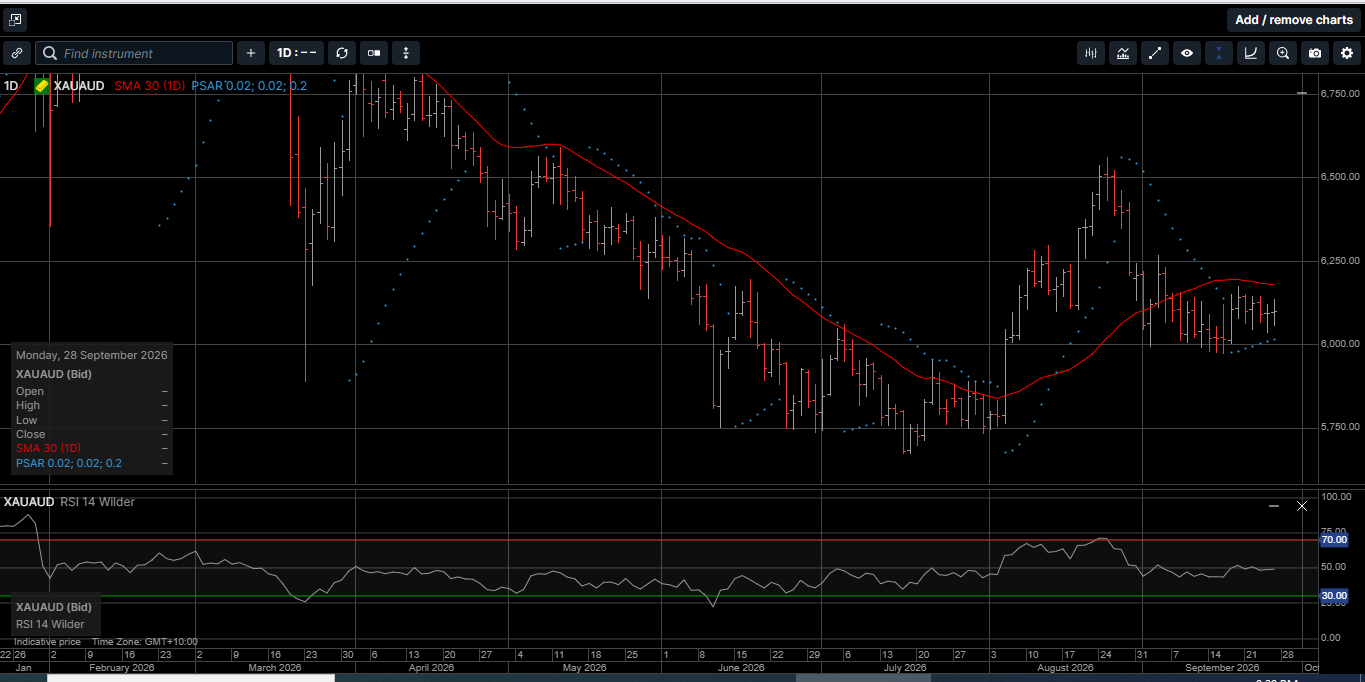
Gold denominated in AUD finished the week fractionally lower at $6098.00. The daily RSI is flat at 49.00. The daily chart shows a Flag Pattern dating back to September 7th with support at $6000.00 and resistance at the 30-DMA near $6180.00.
Physical Silver priced in USD traded on both sides of the 30-DMA last week but dropped into the weekend to close 3.0% lower at $64.25.
The daily RSI is 47.70. The upward slope from the July lows near $55.00 remains intact with initial support at $62.30. A daily close above $67.50 would improve the technical outlook.
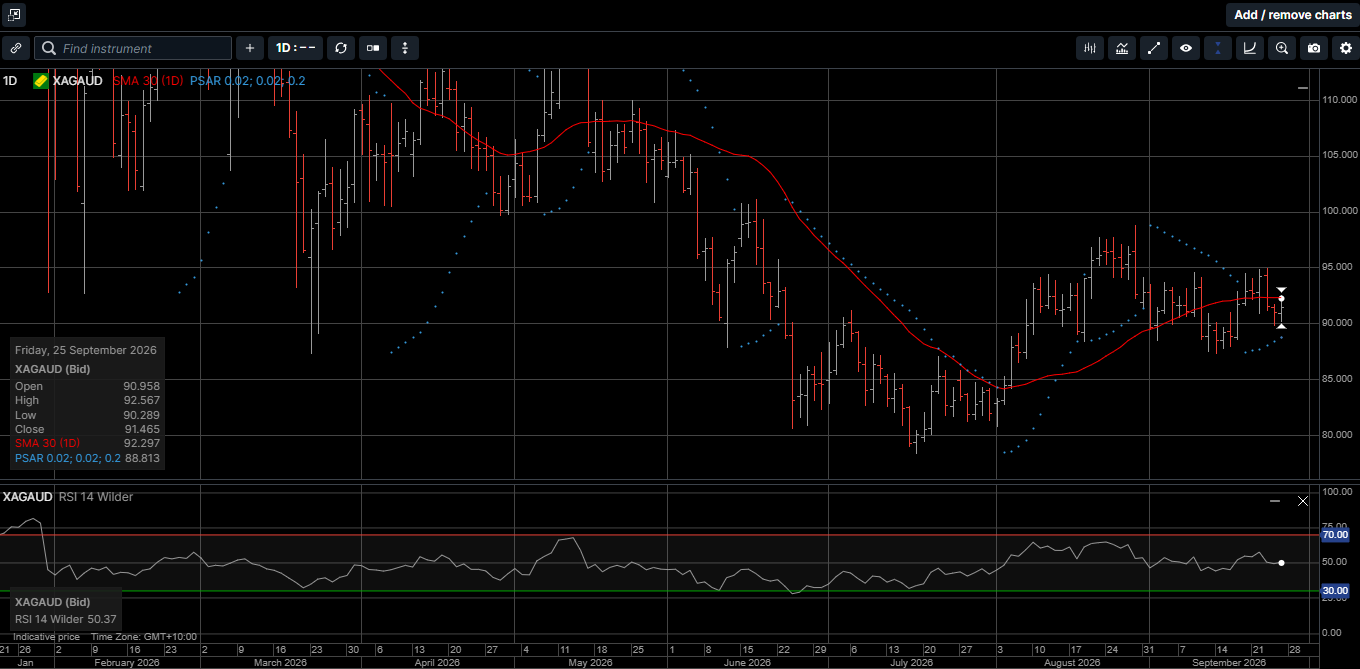
Silver denominated in AUD drifted below the 30-DMA last Friday and closed out the week 1.4% lower at $91.50. The RSI is a flat reading of 50.30.
The upward slope from $78.50 remains intact with initial support at 88.50 and resistance in the $94.60 to $94.80 range.
The Gold versus Silver ratio rose 1.0% in favor of Gold to close at 66.55, which means it takes 66.55 ounces of Silver to equal the price of one ounce of Gold.
The ratio has had a downward bias since posting 72.50 in July. We prefer the short side back into the low 60.00 handle.
Physical Platinum posted a downside reversal last Wednesday below the 30-DMA and settled 1.2% lower at $1780.00.
The daily RSI is 49.50 and pointing higher. Initial support is the double bottom at $1730.00. A daily close above $1845.00 could trigger range extension to the upside.
By almost every historical correlation, the precious metals complex should be substantially lower than it is today. And the fact that it isn’t can be considered a call to action for investors with a longer-term time horizon.
The US Federal Reserve is tightening monetary policy; the USD Index is near a three-month high, and, as illustrated on Chart 1, the 10-yr Treasury yield has surged to around 5.20%, its highest level in over 20 years.
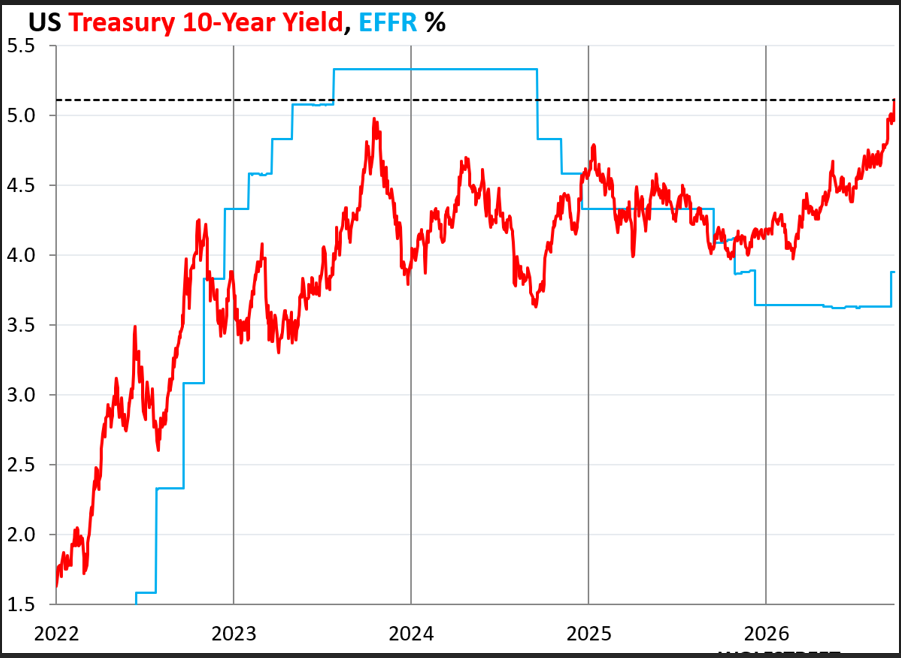
The World Gold Council (WGC) pricing models suggest that every 25-basis-point increase in the US 10-yr Treasury yield translates into roughly a 1.75% decline in Gold.
Using the WGC pricing equation, with yields surging higher, Gold prices should be well below $4,000 an ounce.
Instead, Gold is holding around $4,300. This resilience underscores just how dramatically the precious metals have diverged from their traditional relationship with interest rates.
To put a finer point on this dynamic, since US yields started trending higher in early March, the US 10-yr yield has risen by 31%, and the 30-yr yield is 21% higher. On the short-end of the curve, the yield on the 2-yr note is 44% higher.
During that same period of time, Gold is 4.6% lower, and Silver and Platinum have only lost 7.7% and 11.0%, respectively.
But considering the strong magnitude of these interest rate pressures, and the corresponding strength in the USD, the losses in the precious metals remain remarkably contained.
There is little doubt that investors are no longer looking at hard assets simply through the prism of interest rates.
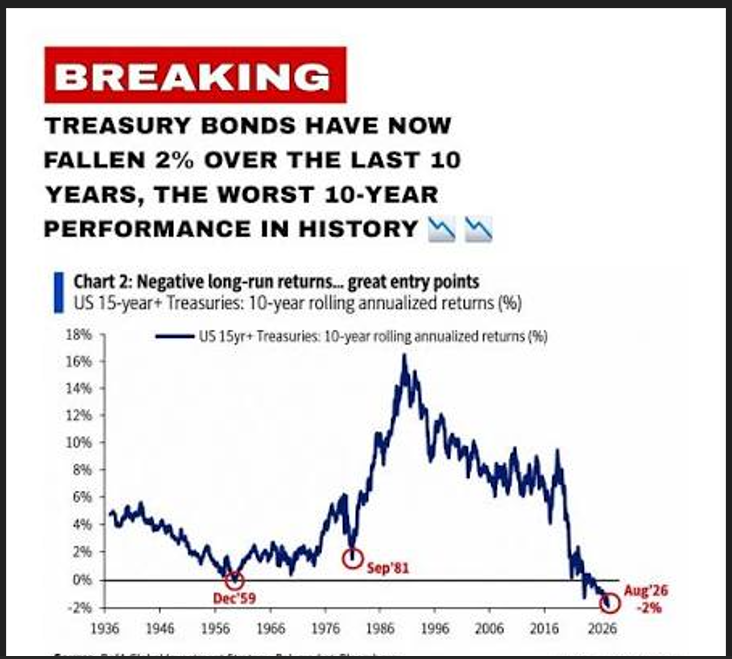
Further, as shown on Chart 2, at some point large institutional money will come in and buy these higher yields as the negative long-run returns can only improve and drive yields lower, which can simultaneously strengthen the investment case for precious metals.
Then we look at the condition of Wall Street, where the response to historically expensive stocks has been: what if we bought even more of them with borrowed money?
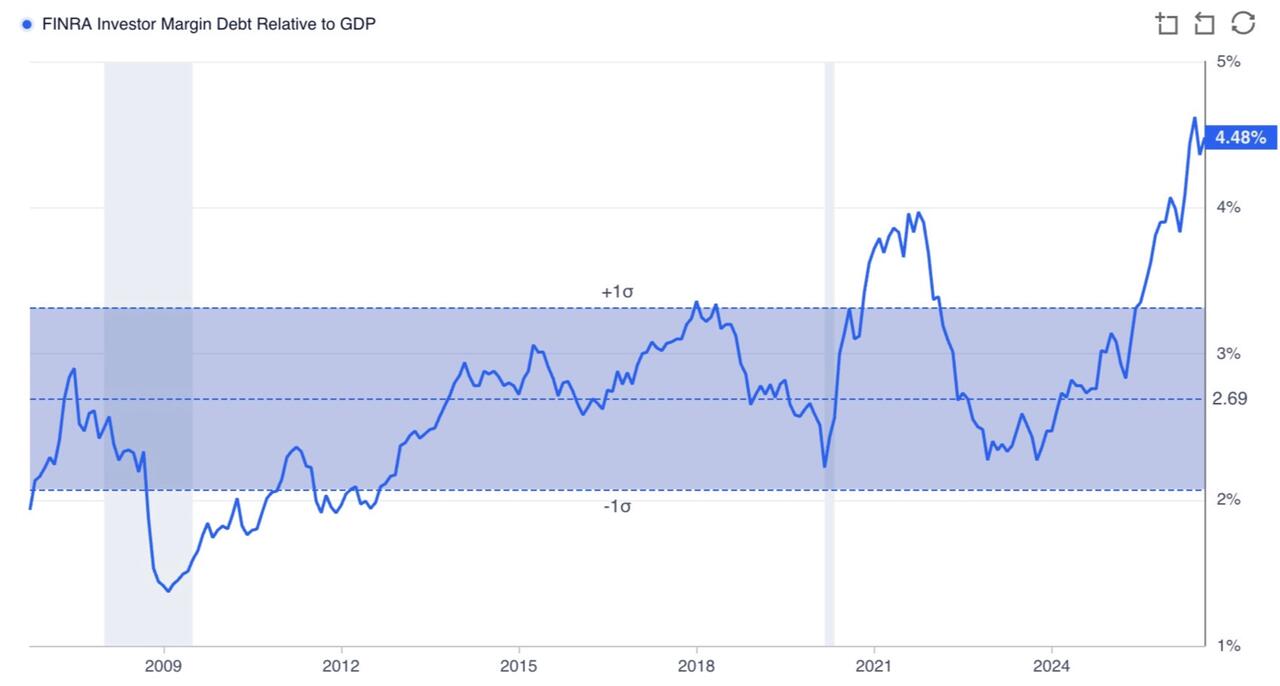
As shown on chart 3, the Financial Industry Regulatory Authority (FINRA) margin debt was about $1.45 trillion in August, up roughly 37% from a year earlier, after reaching a record $1.50 trillion in June.
Leverage works wonderfully until it doesn’t. Stocks rise, collateral values rise; investors borrow more, and that borrowed money can buy more stocks.
Now, reverse the direction.
Stocks fall; collateral values fall, margin requirements bite, and people start selling because they have to cover margin calls. Selling creates more selling.
That’s how leverage turns a correction into an avalanche.
We are not predicting a crash on Wall Street. However, higher rates have been the catalyst in the past.
The US market doesn’t have cheap stocks, low leverage, and pristine balance sheets encountering this environment of higher rates.
The US has enormous government debt, enormous consumer debt, enormous corporate borrowing, record margin leverage, stressed private-credit liquidity, speculative AI financing, and investors who have been conditioned for nearly two decades to believe that every meaningful decline will eventually be rescued by the Federal Reserve with liquidity injections.
In short, there is an extraordinary amount of leverage sitting on top of asset prices that were built for a world where money was cheap, and the recent surge in yields is showing that the bond market is threatening to make money expensive again.
The time to prepare for a material correction in stock prices is before it happens.
Gold, Silver and Platinum offer wealth security, a store of value, and remain an important portfolio diversifier as investors confront persistent inflation, geopolitical uncertainty, and growing concerns surrounding government finances.
The resilience that Gold, Silver and Platinum have shown in a higher interest rate environment suggests the long-term bullish trend can accelerate once rates revert lower.
As such, now is the time to consider scaling out of underperforming stocks and adding more hard assets to your long-term wealth creation strategy.
This publication has been prepared for the GBA Group Companies. It is for education purposes only and should not be considered either general of personal advice. It does not consider any particular person’s investment objectives, financial situation, or needs. Accordingly, no recommendation (expressed or implied) or other information contained in this report should be acted upon without the appropriateness of that information having regard to those factors. You should assess whether or not the information contained herein is appropriate to your individual financial circumstances and goals before making an investment decision or seek the help the of a licensed financial adviser. Performance is historical; performance may vary; past performance is not necessarily indicative of future performance. Any prices, quotes or statistics included have been obtained from sources deemed to be reliable, but we do not guarantee their accuracy or completeness.