Gold, Silver and the Fog of War
by Joel Cameron
Posted on 16 Mar, 2026 in
As military activity escalated in the Middle East last week, the impact on financial markets across most asset classes became more pronounced.
Fear is growing that the war will cause a protracted period of higher energy costs and increase consumer inflation, which could then prevent the US FED from lowering interest rates, strengthen the USD and creating a headwind for the precious metals.
In contrast, we believe a more likely outcome is that the war effort will materially increase the $38 trillion US deficit and effectively force the FED to lower rates into a rising inflation/slowing economic growth environment.
The combination of these fundamentals is known as Stagflation, which is very bullish for Gold, Silver and Platinum prices over a longer-term time horizon.
For the week, physical Gold priced in USD fell 3.1% and closed at $5019.00
This slip lower in Gold marks two consecutive lower weekly closes for the first time since late October, and the first close below its 30-Day Moving Average (30-DMA) since November 21.
More price consolidation could be expected over the near-term, and a move back over $5215.00 would flip the momentum indicators back to positive.
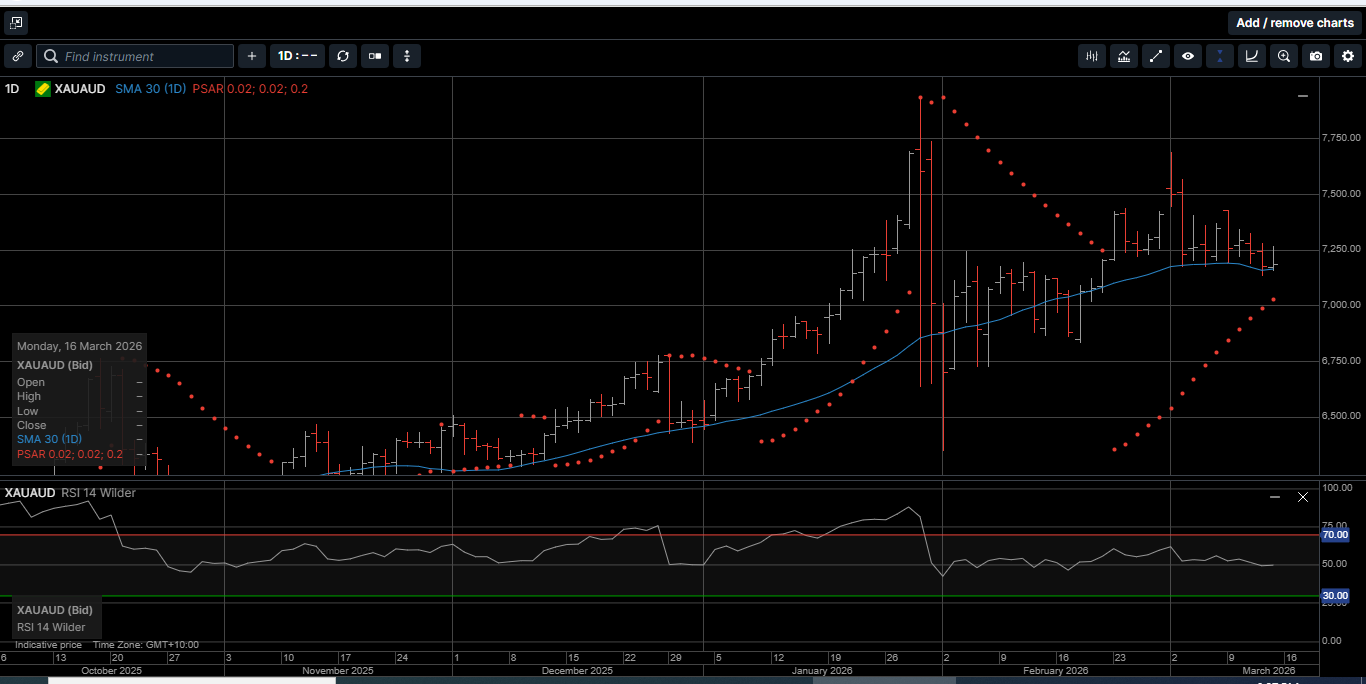
Gold denominated in AUD traded on both sides of its 30-DMA last week and finished last Friday with a 2.5% loss at $7186.00. A close above $7425.00 would improve the technical outlook.
Physical Silver priced in USD traded on both sides of its 30-DMA and finished the week 3.8% lower at $80.45. Initial resistance is now in the $89.50 to $89.80 range.
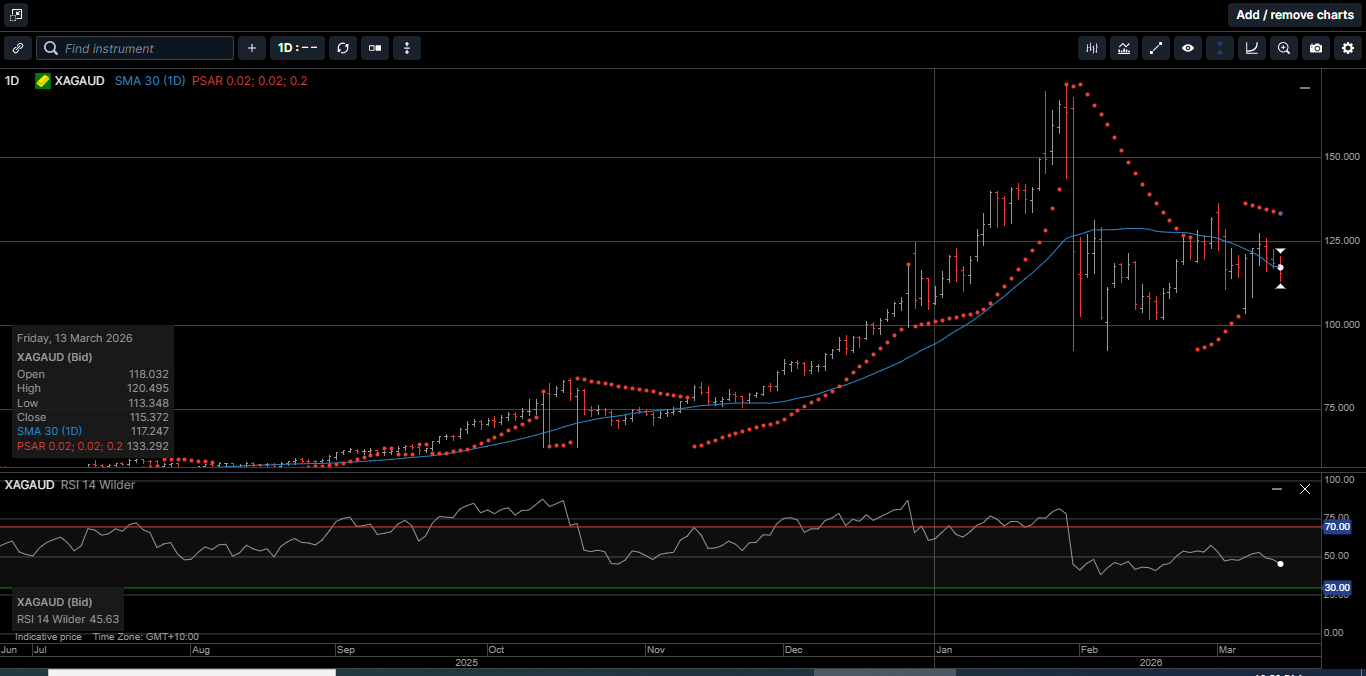
Silver denominated in AUD slid 3.9% lower to settle the week at $115.35. A key chart point at $128.60 looks to be out of reach for now, but a close above could signal another leg higher.
The Gold versus Silver ratio moved 2.4% in favor of Gold to close at 62.17. That means it takes 62.17 ounces of Silver to equal the value of one ounce of Gold.
Physical Platinum traded on both sides of its 30-DMA and tested the bottom end of its recent range.
And while the $2000.00 support level could be frayed this week, we see it as a good level to scale into additional long positions for a longer-term position.
The price of crude oil is being closely watched and has risen by over 50% since the conflict in the Middle East began two weeks ago.
But how much long-term risk is being priced into the global energy market?
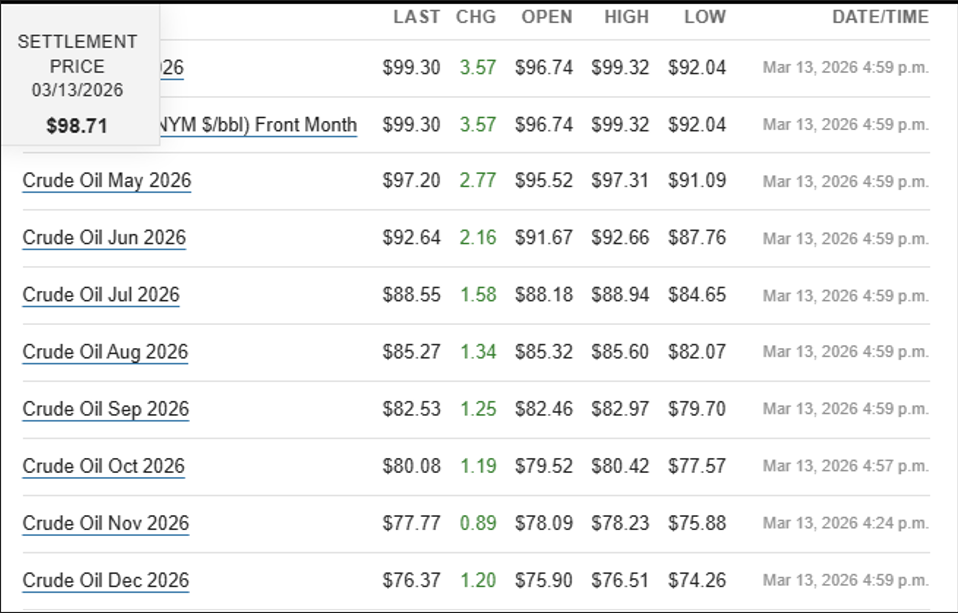
Chart 1 shows last Friday’s closing prices for the West Texas Intermediate (WTI) Crude Oil contracts traded on the New York Mercantile Exchange.
Each contract represents 1000 barrels, or 42,000 gallons, or 160,000 liters of WTI for each of the next nine delivery months.
Because of the large volume and weight of each contract, it is not unusual for the price structure of crude oil to reflect a Backwardation Pattern, which means the near months trade higher than the future months.
However, the April contract closed at $99.30 and the December at $76.37. That means WTI for December delivery is priced 23% lower than the current spot month.
This pricing structure could change if the shipping lanes through the Persian Gulf become further contested over the next few weeks.
But for now, contrary to many financial media reports, the WTI market is pricing in a short-term price squeeze and not a protracted energy supply line crisis.
With respect to the US FED holding the FED Funds rates at current levels due to an uptick in consumer inflation, the current growth data suggests the risk of a recession could outweigh the risks of an “energy-driven” uptick in inflation.
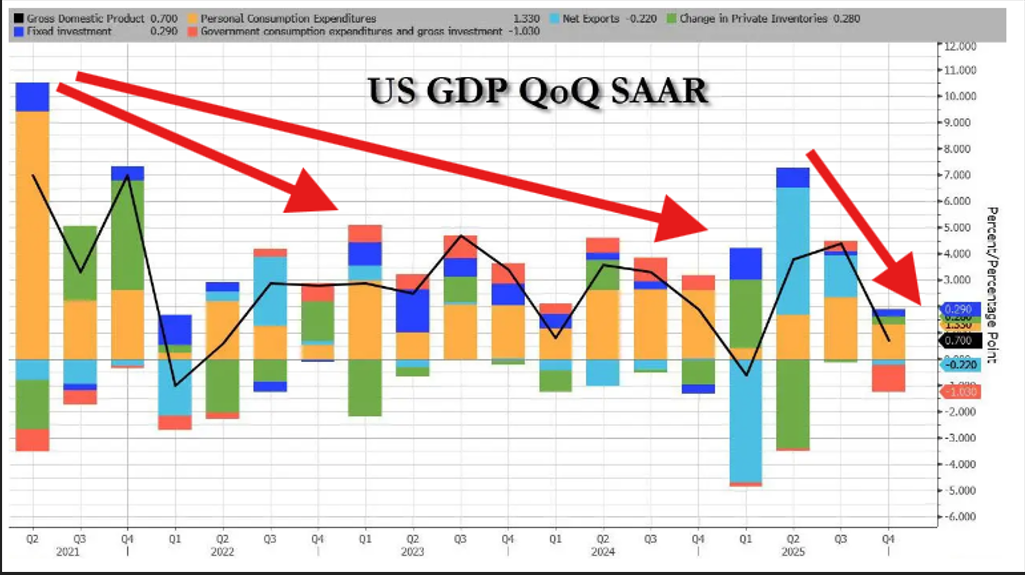
Chart 2 illustrates several growth aggregates that are pointing decisively lower on a Seasonally Adjusted Annual Rate (SAAR) basis going into 2026.
These indicators include GDP, Personal Consumption, Fixed Investment, Net Exports, and Inventories.
The US FOMC meets this week to announce the current state of policy and to release their current individual economic projections.
And while a cut to the FED Funds rate is not expected, it is likely that the FED governors will include the risk of energy inflation as well as the risk of recession in their economic projections.
Even though the precious metals complex has traded lower over the last couple of weeks, they still are outperforming most other asset classes on a year-to-date basis.
For example, the SP 500 is down 3.8% on a year-to-date basis while Gold has returned 16.2%, Silver is up 12.5% and Platinum has gained just over 2.0%
It is impossible to predict how long the conflict in the Middle East will last and how dense the fog will get that obscures economic realities.
What is certain is that hard assets increase wealth security, and physical Gold, Silver and Platinum represent the purest forms of safe-haven money.
Now is the time to consider taking advantage of the recent pullback in prices and add more precious metals to your long-term portfolio.
This publication has been prepared for the GBA Group Companies. It is for education purposes only and should not be considered either general of personal advice. It does not consider any particular person’s investment objectives, financial situation, or needs. Accordingly, no recommendation (expressed or implied) or other information contained in this report should be acted upon without the appropriateness of that information having regard to those factors. You should assess whether or not the information contained herein is appropriate to your individual financial circumstances and goals before making an investment decision or seek the help the of a licensed financial adviser. Performance is historical; performance may vary; past performance is not necessarily indicative of future performance. Any prices, quotes or statistics included have been obtained from sources deemed to be reliable, but we do not guarantee their accuracy or completeness.