Gold And Silver Get Whipsawed After Upside Surprise In US Payrolls
The precious metals complex traded actively last week in front of the US labor Day long weekend.
There were two distinct events that impacted financial markets.
On Wednesday, FED Governor Chris Waller said if US inflation moderates, he will vote to hold the FED Funds rate unchanged at the September 16 FOMC meeting, which lifted the metals higher.
However, that rally was unwound on Friday after the headline US Non-Farm Payroll (NFP) report printed much higher than the consensus forecast.
This price action suggests that interest rate uncertainty is currently the primary driver of Gold, Silver, and Platinum.
Physical Gold priced in USD dipped below the 30-Day Moving Average (30-DMA) at $4325.00 but recovered to close the week fractionally lower at $4429.00.
The daily Relative Strength Index reflects a neutral reading at 43.00. Initial support is $4310.00, and resistance is just above $4550.00.
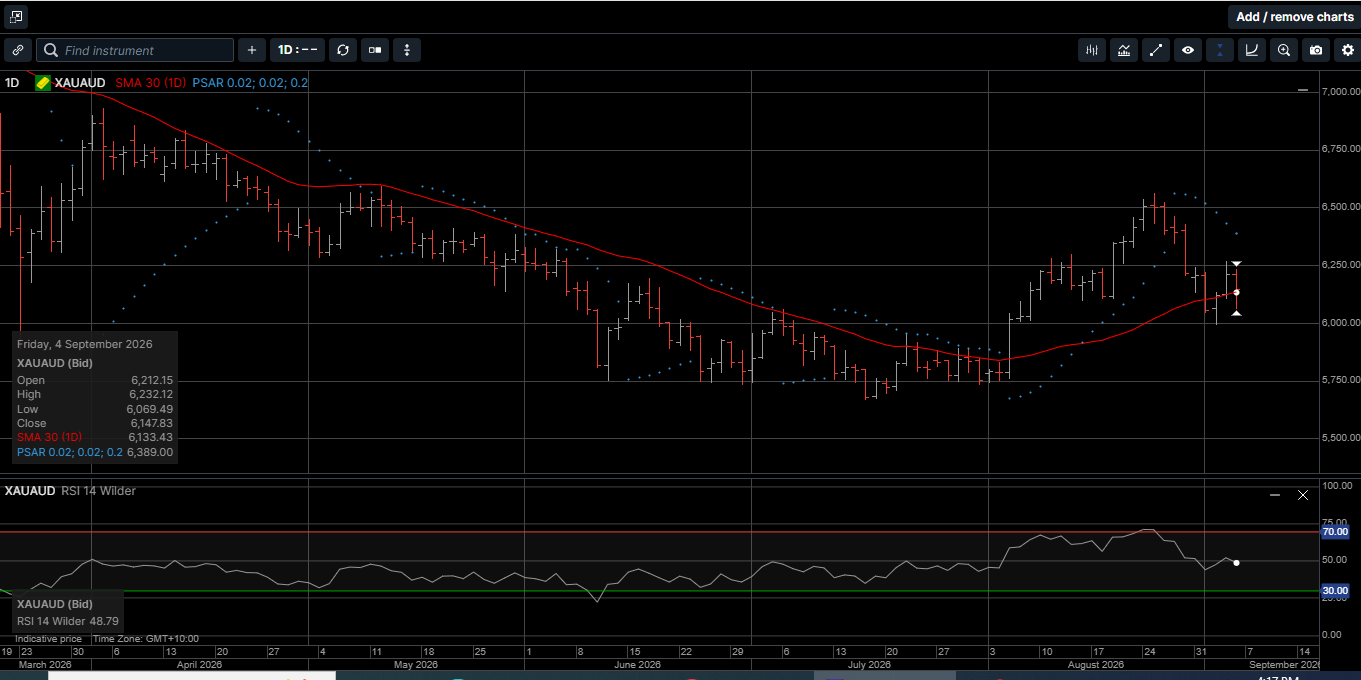
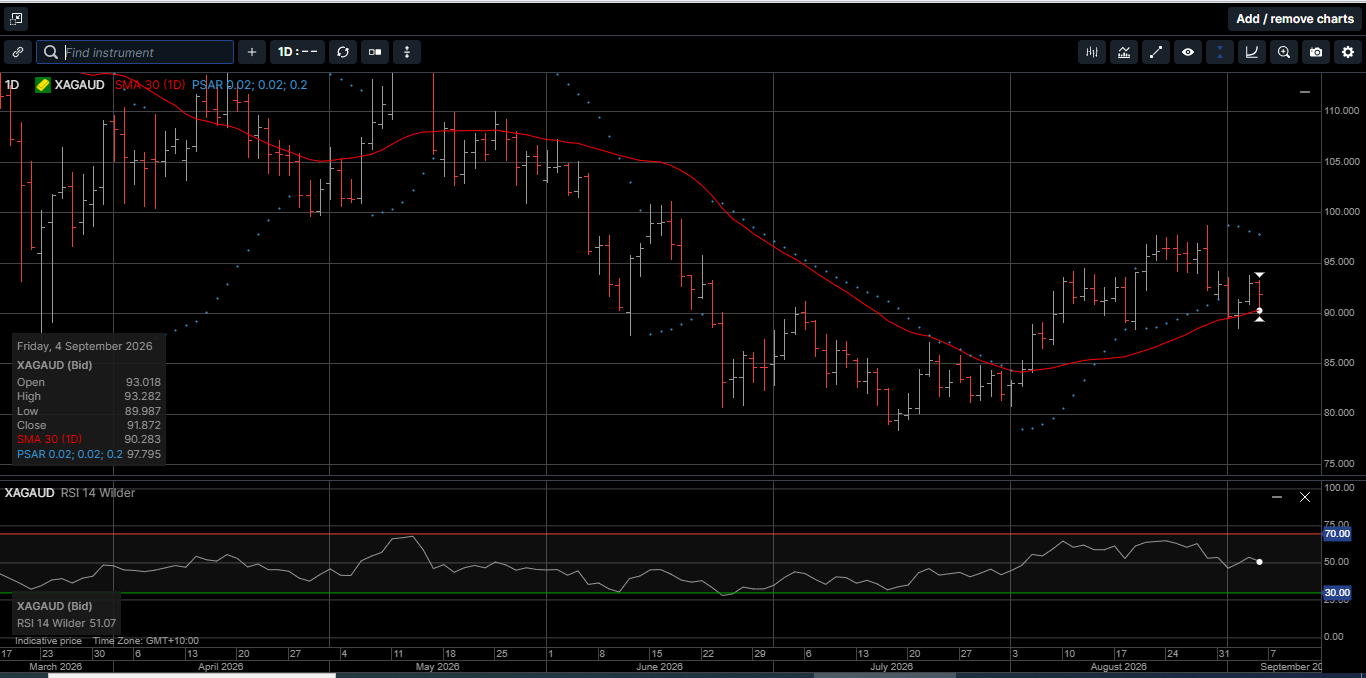
Gold denominated in AUD traded on both sides of the 30-DMA during four of the five sessions last week (see Chart 4) and finished the week 1.1% lower at $6147.00.
The daily RSI is 49.00. Initial support is $6040.00, and resistance is in the $6260 to $6280.00 range.
Physical Silver priced in USD tested the 30-DMA at $63.50 but bounced to close out the week fractionally lower at $66.20.
The RSI reflects a slightly positive 53.25. Initial support is $63.10, and resistance is $68.15.
Silver denominated in AUD frayed the 30-DMA at 88.60 but recovered to close 1.0% lower at $91.87. The daily RSI reflects a neutral reading of 51.00. Initial support is $88.20, and resistance is in the $94.30 to $94.60 range.
The Gold versus Silver ratio finished the week slightly lower in favor of Silver at 66.80, which means it takes 66.80 ounces of Silver to equal the price of one ounce of Gold.
Physical Platinum slid below the 30-DMA at $1710.00 last Wednesday and then found a bid to close out the week unchanged at $1820.00.
The daily RSI is 56.40 and pointing higher. Initial support is $1710.00, and resistance is in the cluster of highs near $1885.
As mentioned above, last Friday’s headline payroll number printed at 162,000 new jobs versus a consensus estimate of 55,000. The hourly earnings and unemployment rate components were as expected at 0.3% and 4.1%, respectively.
From the 1990’s to about 10 years ago, the US NFP report was the pinnacle of incoming economic macro data for the FED to formulate their interest rate trajectory.
The market impact of a strong or weak NFP report could last for weeks and influence stocks, currencies, interest rates, and hard assets.
Now, with steep revisions almost monthly and opaque seasonal employment inputs, it seems the NFP report has joined the mélange of other quickly overlooked monthly data.
For example, as illustrated on Chart 1, new job creation in the US has printed a negative number during six of the last 15 months, which is not an indication of an overheating employment market.
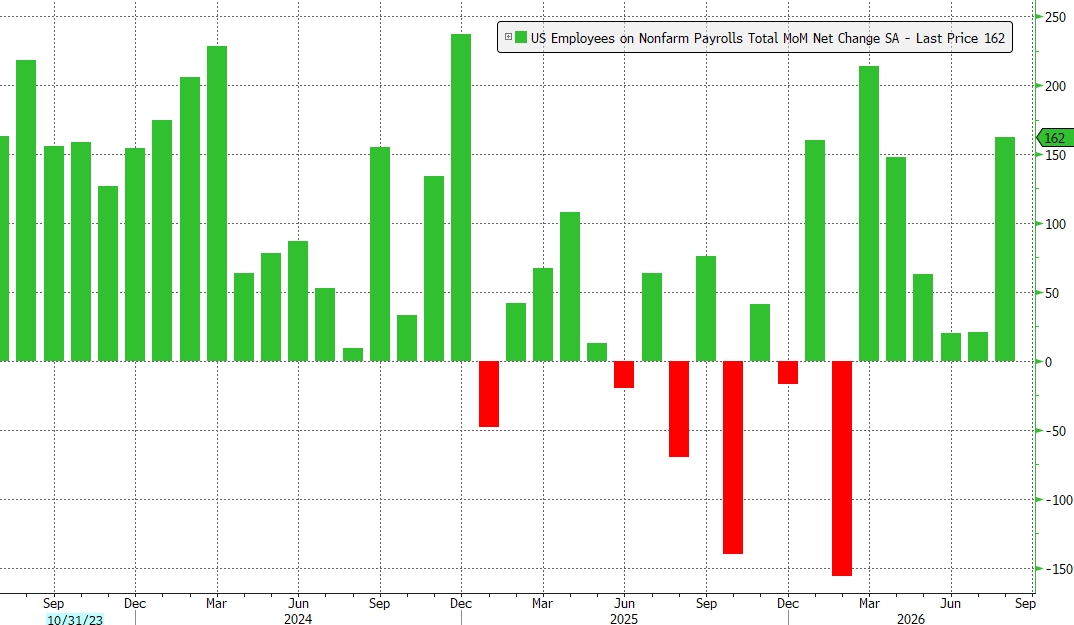
In fact, of the 162,000 new jobs announced last Friday, 72,000 were tabulated using the seasonal birth/death model, which is almost always revised lower.
The point is that the US central bank leadership has been clear that, with respect to their dual mandate, lowering consumer inflation to their 2% target is more important than full employment.
Along those lines, considering the current “pass through” inflation is largely driven by rising energy prices, we don’t expect last Friday’s NFP report to move the needle decisively toward a FED Funds rate hike later this month.
It is difficult to imagine how a 25-basis point increase in the FED funds rate will lower the cost of crude oil.
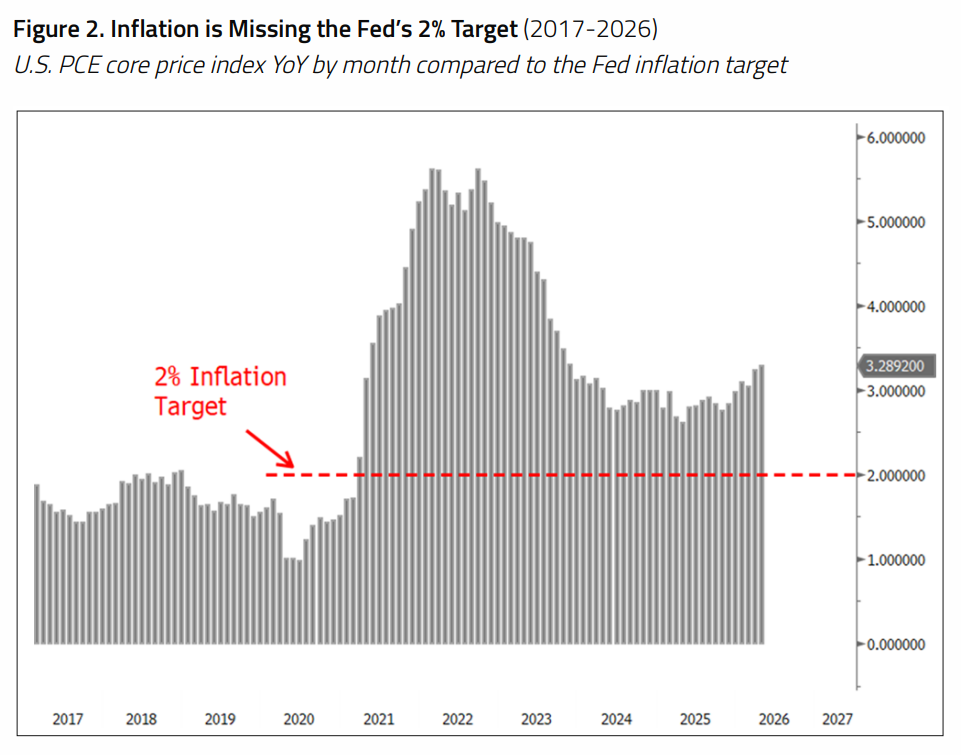
Besides, as shown on Chart 2, the US Personal Consumption Expenditures index has not been below the 2.0% target in more than five years, which suggests that the 2.0% target is not really a rule, but more of a guideline.
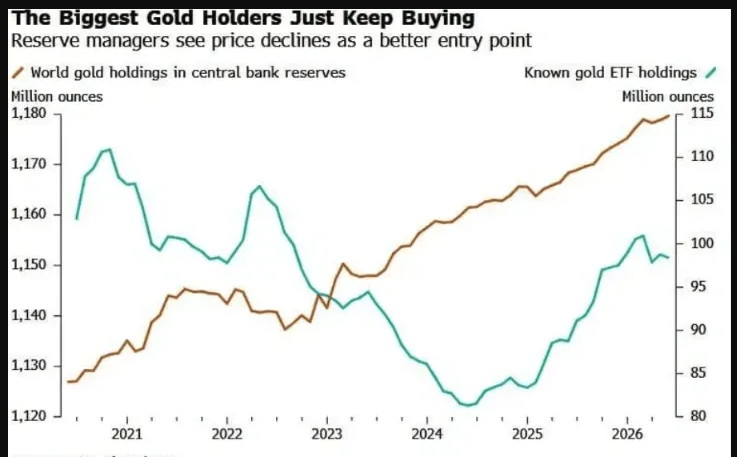
From a broader economic viewpoint, as shown on Chart 3, central banks and funds are still the main pillar of support for hard assets.
After a strong rally backed by speculative money took Gold, Silver, and Platinum to all-time highs in January, the metals have spent much of this year in consolidation patterns.
Elevated energy prices and inflationary shocks from the Persian Gulf have kept hard assets on the defensive, but central banks and funds are still showing strong interest.
The specific catalyst for buying Gold again in June was an acceleration in central bank purchases during the second quarter.
Central bank and other sovereign sector demand recovered sharply in the period, with net purchases of over 300 tons; the highest for any second quarter in history, according to the World Gold Council.
Global central banks and funds understand that no matter how the Fed tries to tackle inflation, long-term investors are still inclined to hold hard assets.
Hard assets are the purest form of money and have offered wealth security for thousands of years.
Weekly price rotations based on high frequency data points like last week’s NFP report do not dissuade provident investors from looking for a store of value and the safe haven of hard assets.
As such, now is the time to counter macroeconomic and geopolitical uncertainty and consider adding more physical Gold, Silver and Platinum to your long-term wealth creation strategy.
This publication has been prepared for the GBA Group Companies. It is for education purposes only and should not be considered either general of personal advice. It does not consider any particular person’s investment objectives, financial situation, or needs. Accordingly, no recommendation (expressed or implied) or other information contained in this report should be acted upon without the appropriateness of that information having regard to those factors. You should assess whether or not the information contained herein is appropriate to your individual financial circumstances and goals before making an investment decision or seek the help the of a licensed financial adviser. Performance is historical; performance may vary; past performance is not necessarily indicative of future performance. Any prices, quotes or statistics included have been obtained from sources deemed to be reliable, but we do not guarantee their accuracy or completeness.