Gold and Silver Enter the Accumulation Phase
Reports out of the Middle East continue to drive the daily financial news cycle.
After finding buyers near the panic phase lows on March 23, the precious metals complex rallied back above technical resistance levels by mid-April.
Without clear developments in the Persian Gulf and in front of the FOMC announcement this Wednesday, more high-level consolidation could keep Gold, Silver and Platinum prices contained within recent ranges.
This price action can be considered an accumulation phase for longer-term investors looking to prepare for the next leg higher.
Physical Gold priced in USD traded on both sides of its 30-Day Moving Average (30-DMA) during every session last week and finished 2.5% lower at $4709.00.
This close is just above the 30-DMA at $4704.00, which sets initial daily support at $4640.00 and resistance at $4835.00.
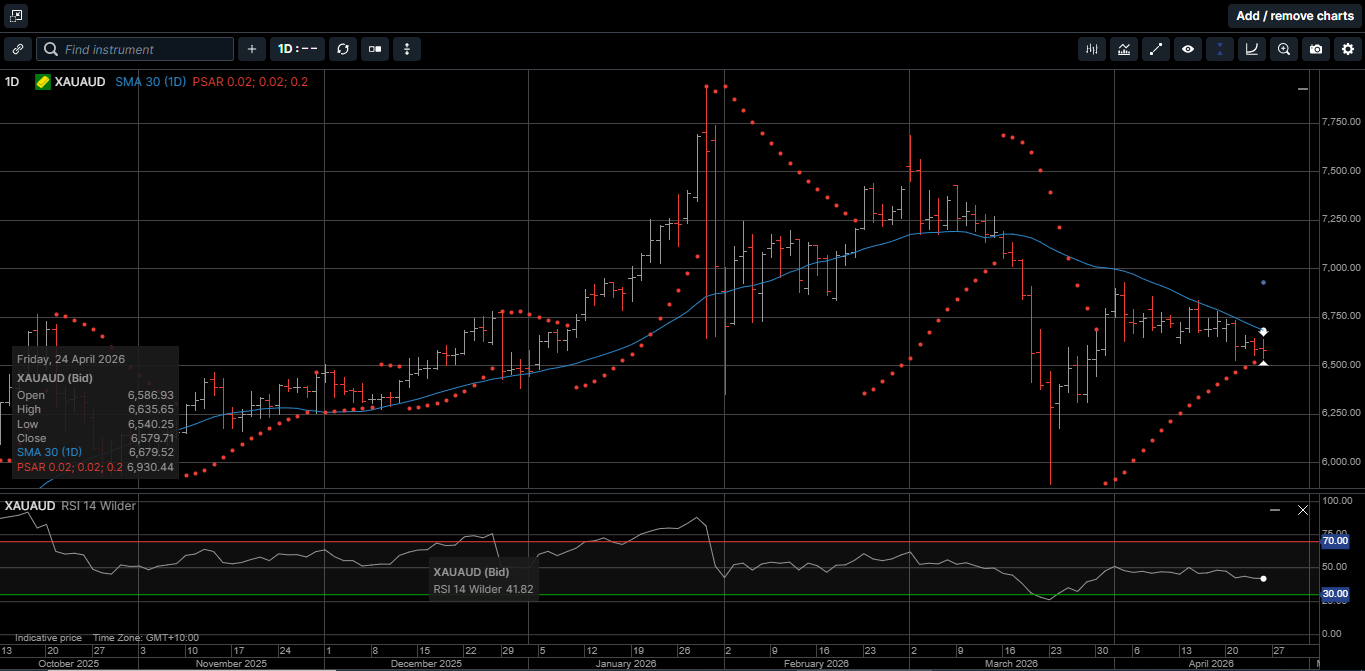
Gold denominated in AUD slipped 2.1% lower and closed in the middle of the weekly range at $6580.00, which is still below its 30-DMA at $6680.00
AUD Gold has not posted a daily close above its 30-DMA since March 13th. During that time, the AUD/USD has risen by 4.3%, which has acted as a headwind.
Physical Silver priced in USD traded in relatively narrow ranges and ended the week 6.3% lower at $75.70.
Despite losing ground on the week, USD Silver closed above its 30-DMA at $74.95, which maintains its bullish posture and now targets initial resistance at $83.05.
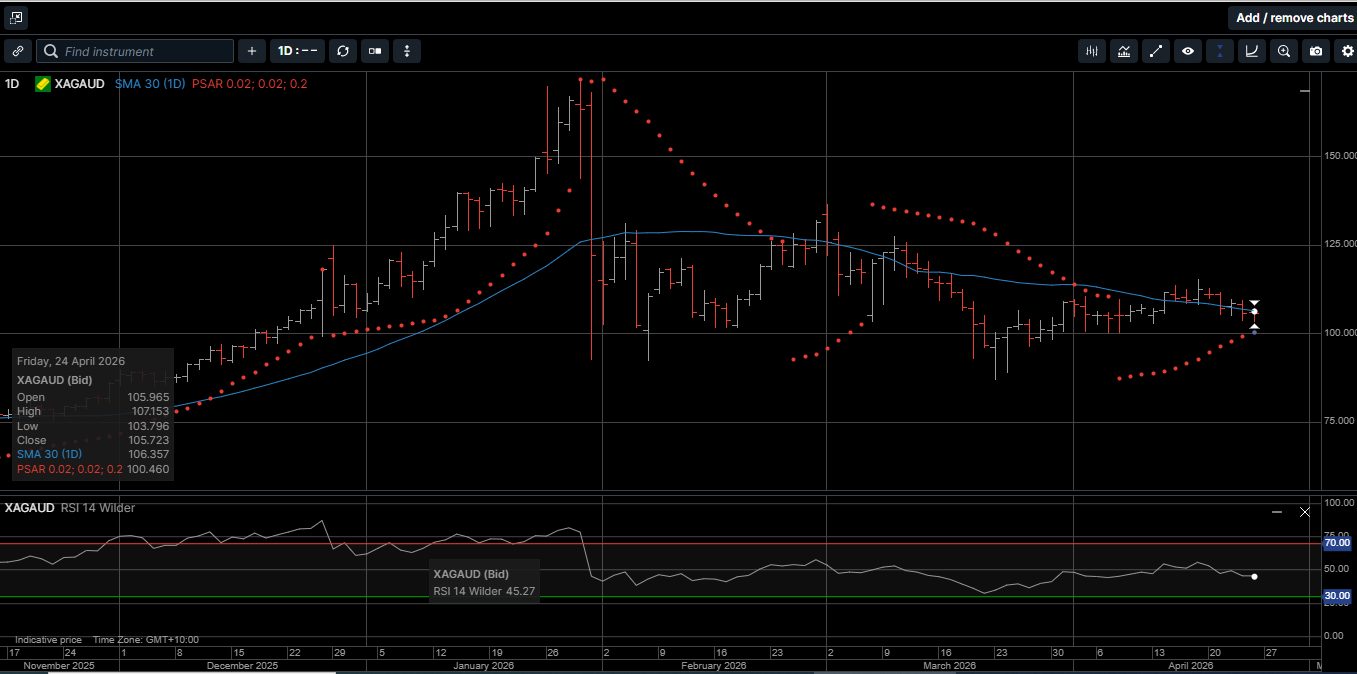
Silver denominated in AUD traded on both sides of the 30-DMA during four out of the five trading sessions last week and closed down 6.1% at $105.70.
Friday’s close was just short of the 30-DMA at $106.35, which suggests upside momentum is still building.
The Gold versus Silver ratio gained 1.8% in favor of Gold to close at 62.10. This means it takes 62.10 ounces of Silver to equal the value of one ounce of Gold.
We would not be surprised to see this ratio contained within the 65.00 to 55.00 trading range over the next few weeks.
Physical Platinum drifted 4.6% lower and closed out the week at $2013.00.
Despite the lower weekly close, Platinum finished above its 30-DMA during four of the last five trading sessions. This suggests that higher prices are the path of least resistance.
We see $2155.00 as a key pivot point on the daily price chart.
Global capital markets will end the month of April with a sense of transition rather than resolution as the geopolitical backdrop seems a long way from settled.
The conflict in the Middle East is unresolved, and the disruptions are multifaceted and will linger. Shipping routes, insurance costs, and regional supply chains will not snap back quickly.
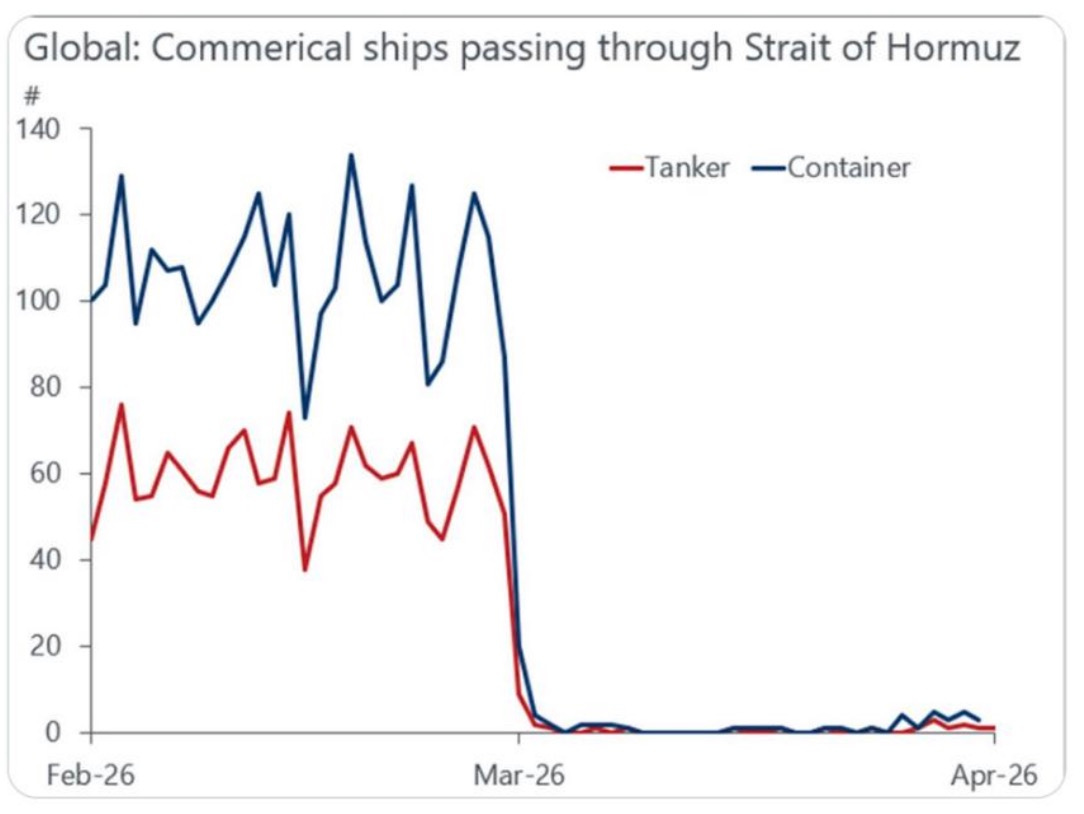
As illustrated on Chart 1, commercial shipping through the Strait of Hormuz has literally collapsed.
In Washington, D.C., the US Federal Reserve faces its own uncertainty.
Chairman Jerome Powell’s term ends mid-May, and there does not appear to be any obstacles to the confirmation of Kevin Warsh to replace him.
During his confirmation hearing on Capitol Hill last week, Mr. Warsh made it clear that his tenure was going to be focused on the FED’s dual mandate and preserving independence from political influence.
There is nothing unusual about that testimony.
However, Mr. Warsh surprisingly mentioned the topic of revaluing the US Gold reserves.
Sovereign Gold is currently being carried on the US government balance sheet at a little more than $42.00 per ounce or around $11 billion.
Some administration officials have argued for some time that the Gold should be re-valued.
Considering Gold’s volatility, pricing the yellow metal around the current market price seems like an exercise in frequent revisions.
Mr. Warsh suggested the new valuation at $2000.00 per ounce, which is less than half of the current price but would still boost the federal government’s assets by more than $500 billion.
The fact that Mr. Warsh would mention this at all underscores his comprehension that managing the swelling US deficit and the debt service will be a challenging priority during his tenure.
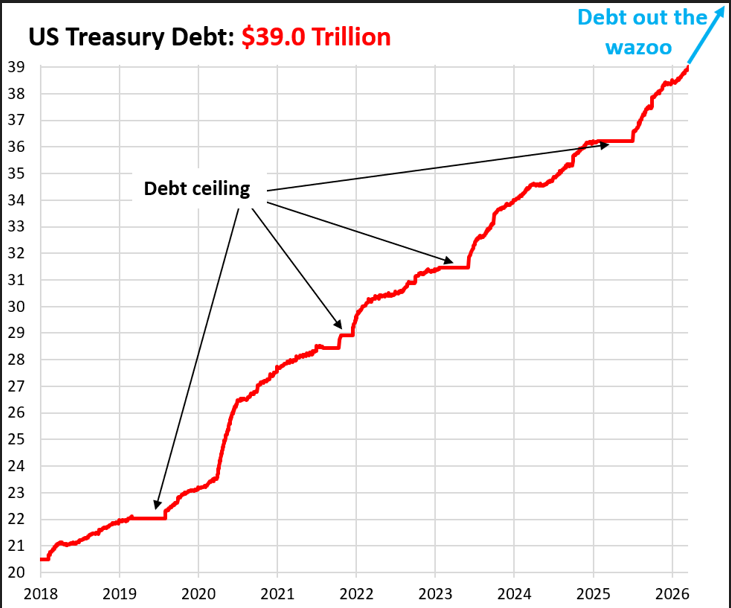
As show on Chart 2, the US deficit has almost doubled over the last five years and could be over $40 trillion by the end of this year.
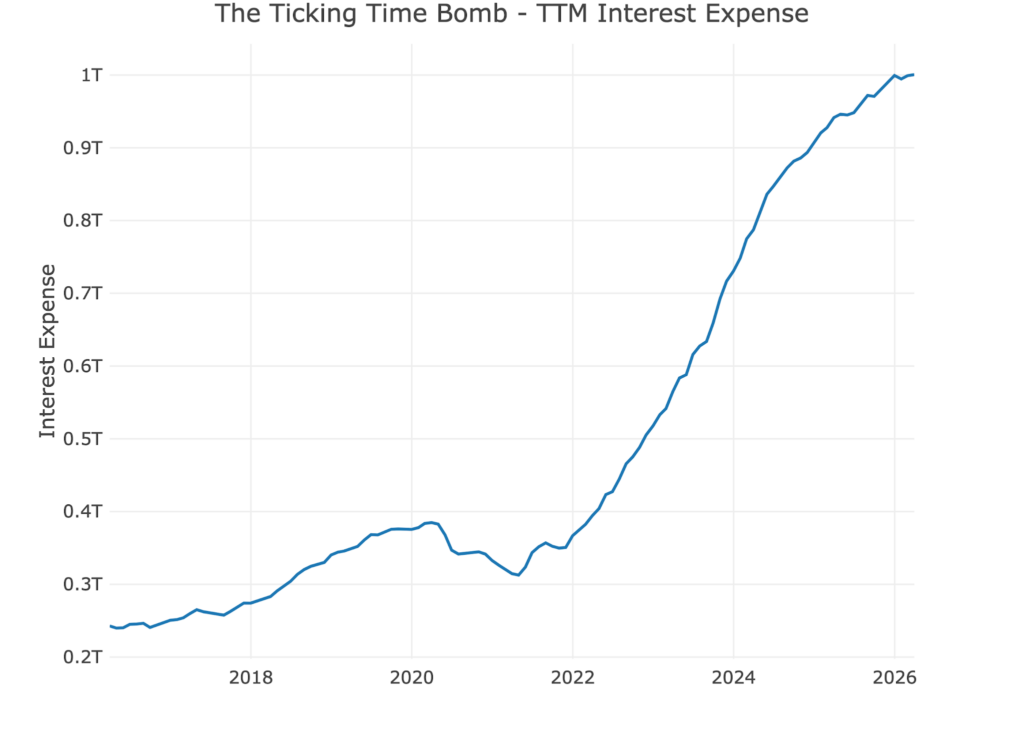
Which, as shown on Chart 3, has resulted in the 12-month trailing debt servicing costs to almost triple in less than four years.
Mr. Warsh knows that this level of debt servicing is not sustainable, which is why he proposes to revalue the US sovereign Gold to boost the FED’s balance sheet.
Central banks know this debt servicing burden is unsustainable, which is why they will likely acquire another 1000 metric tons of physical Gold this year.
Gold, Silver, and Platinum have no counterparty risk and have represented a store of value and security since the beginning of time.
After the strong rally in January, followed by the panic selloff phase in March, the precious metals complex has currently entered the accumulation phase.
Just like the price action during January of this year, we expect the accumulation phase to give way to the acceleration phase over the medium term.
As such, now is the time to consider making physical Gold, Silver, and Platinum the cornerstone assets in your portfolio for growing secure, long-term generational wealth.
This publication has been prepared for the GBA Group Companies. It is for education purposes only and should not be considered either general of personal advice. It does not consider any particular person’s investment objectives, financial situation, or needs. Accordingly, no recommendation (expressed or implied) or other information contained in this report should be acted upon without the appropriateness of that information having regard to those factors. You should assess whether or not the information contained herein is appropriate to your individual financial circumstances and goals before making an investment decision or seek the help the of a licensed financial adviser. Performance is historical; performance may vary; past performance is not necessarily indicative of future performance. Any prices, quotes or statistics included have been obtained from sources deemed to be reliable, but we do not guarantee their accuracy or completeness.