The kinetic war in the Persian Gulf escalated further last week, which pushed Crude Oil prices higher and lifted US Treasury yields back to 52-week highs.
Despite these fundamental headwinds, the precious metals were well bid on what could be described as technical upside momentum.
A dovish decision on interest rates from the US FOMC this week could act as a catalyst for a stronger move higher in Gold, Silver and Platinum prices.
Physical Gold priced in USD traded higher during five of the last six trading sessions and posted a daily close above the 30-Day Moving Average (30-DMA) for the first time since May 12th.
The yellow metal finished the week 1.1% higher at $4052.00. The Relative Strength Index (RSI) is at 44.50, and initial support is at $3960.00. A close above $4110.00 would improve the technical outlook.
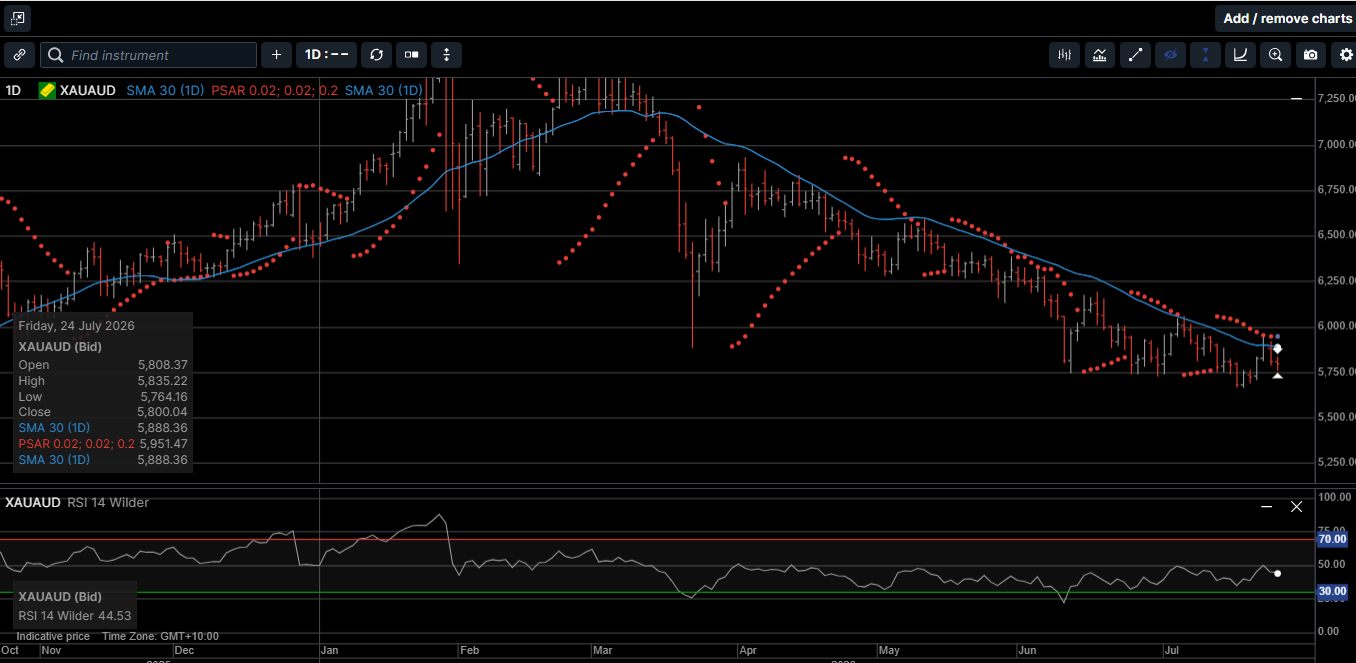
Gold denominated in AUD posted its first daily close above the 30-DMA since March 13th and closed 1.2% higher for the week at $5800.00.
The daily RSI is at 45.25 and rising. We see initial support at $5715.00 and the 30-DMA at $5885.00.
Physical Silver priced in USD posted gains during five of the last six trading sessions and finished the week 4.1% higher at $58.20.
The daily RSI is turning bullish at 43.50 and a close above the 30-DMA at $60.50 looks to be within reach this week. Initial support is in the $57.10 to $57.30 range.
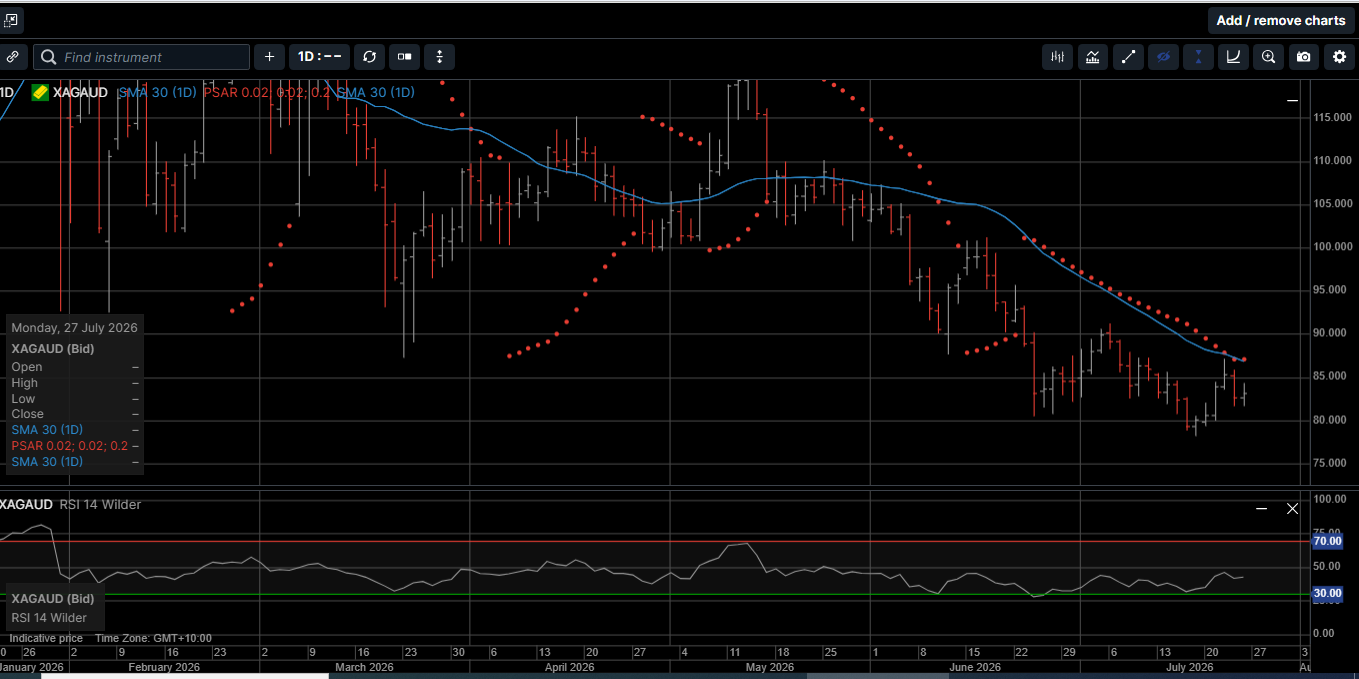
Silver denominated in AUD traded higher during five of the last six sessions for a 3.8% weekly gain and closed out the week at $83.10.
The daily RSI is at 42.60. Initial support is near $80.25, and a daily close above the 30-DMA at $86.80 would suggest a durable low is in place.
The Gold versus Silver ratio fell 3.0% in favor of Silver and closed at 69.50. That means it takes 69.50 ounces of Silver to equal the price of one ounce of Gold.
The internal momentum indicators are pointing lower with initial support in the 67.00 to 67.25 range.
Physical Platinum traded in a relatively narrow range and finished the week fractionally lower at $1590.00.
After pushing above $1670.00 last week we expected to see some range extension higher. The daily RSI is neutral at 41.00, and a close above $1680.00 is needed to turn momentum indicators higher.
As mentioned above, the escalation of the Middle East war sent Crude Oil prices sharply higher and pulled interest rates up, as well.
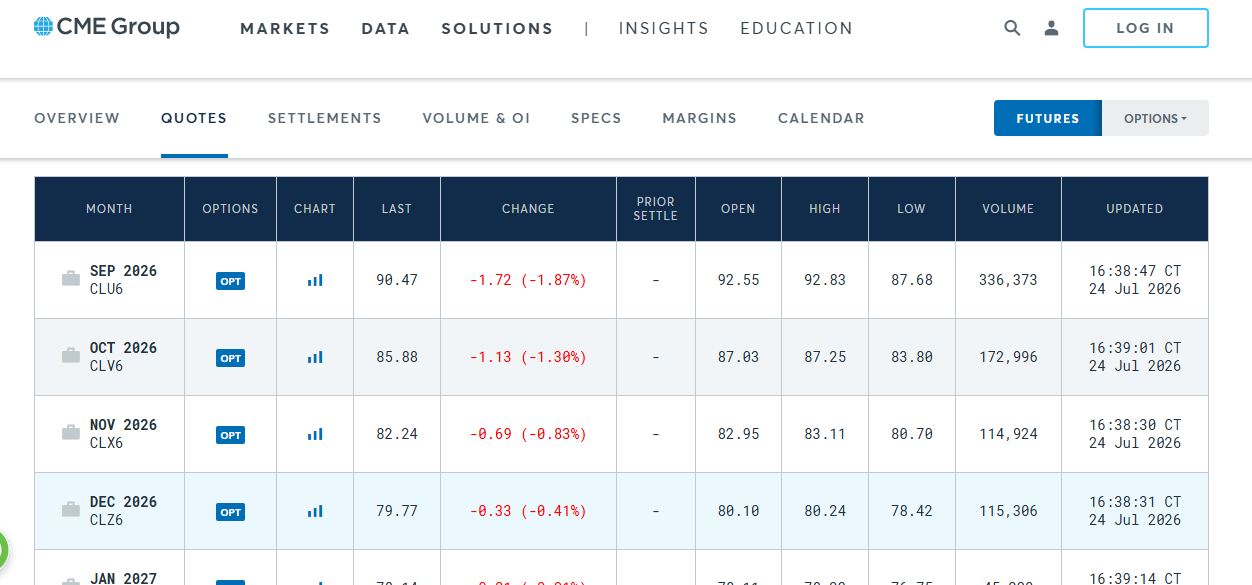
September West Texas Intermediate (WTI) Crude Oil rose by more than 10% last week for a three-week increase of more than 25%, which has had a knock-on effect on inflation and interest rate expectations.
Chart 1 Crude Oil prices
However, as illustrated on Chart 1, the $11.00 spread between the September WTI contract and the December contract suggests physical energy traders are willing to bet that the current high level of pricing stress will not be sustained.
This backwardation pricing in forward Crude Oil prices may be enough to keep the FOMC from lifting rates this week.
In short, if Crude Oil prices slide lower into December, consumer inflation will also trend lower.
The three-week rise in oil prices boosted speculation that the FOMC could raise the FED Funds target rate this week.
The forward derivatives market has about a 30% chance of a hike this week, but is over 60% discounted for the next meeting in September.
The USD, and by extension the precious metals, continues to be sensitive to changes in short-term interest rates.
The 30-day correlation between changes in the USD Index and the December FED Funds futures contract is in the upper end of the range around 0.63. The 60-day correlation is around 0.70.
This can be a very precise relationship in terms of time and price.
However, the price of Gold seems independent, isn’t changing over time, and its value remains stable.
What changes is the amount of fiat currency (USD, YEN, EURO, STERLING, etc.) needed to acquire physical Gold.
An ounce of Gold is simply an ounce of Gold.
In July of 2015, it took $1,100 USD to purchase an ounce of Gold. By July of 2020, you needed $2,000 USD to acquire that same ounce, and now, in July of 2026, that exchange requires $4,100 USD.
With government debt and future obligations now expanding exponentially, it seems reasonable that by July of 2030 or so, it could cost up to $7,500 USD to obtain one ounce of the yellow metal.
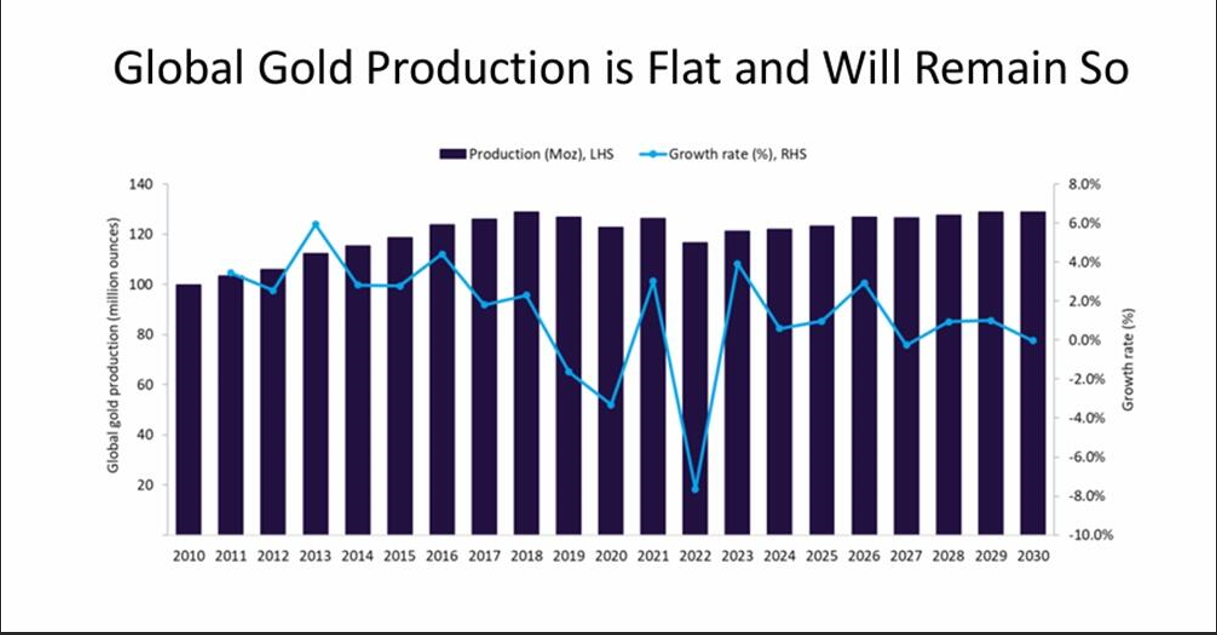
Chart 2 Gold production
As shown on Chart 2, current global Gold production is flat and will remain so into the year 2030.
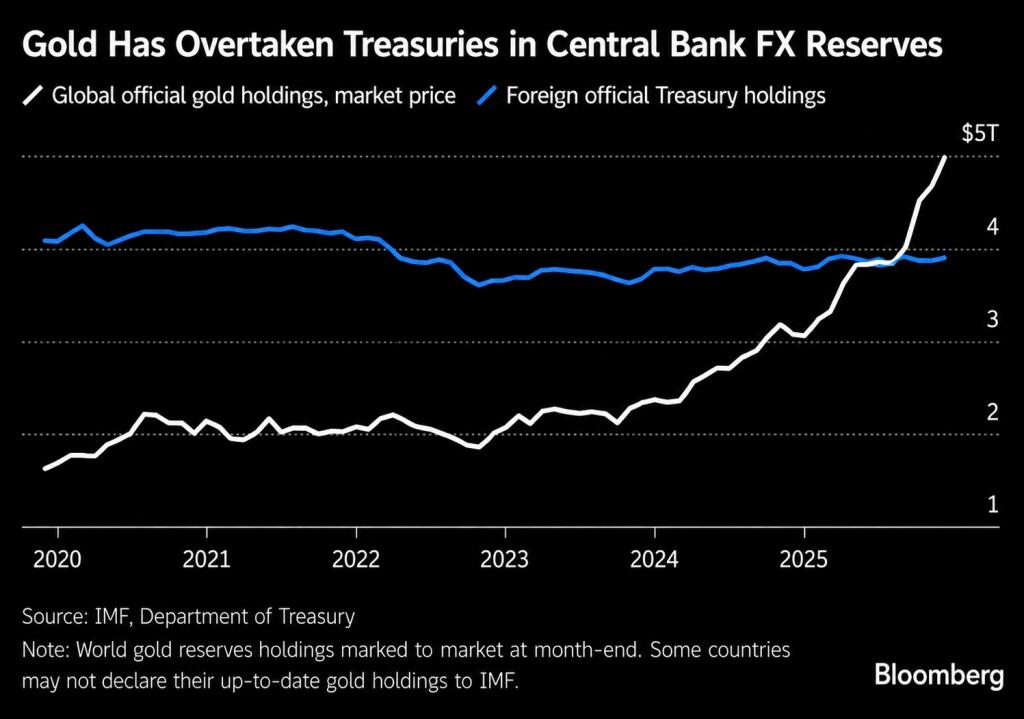
Chart 3 Gold versus Treasuries
Further, as shown on Chart 3, physical Gold has overtaken Treasury securities in central bank FX reserves.
Central banks understand the importance of holding secure, hard assets and avoiding assets that could be marked down due to counterparty risk or geopolitical instability.
Hard assets offer a time proven store of value and wealth security.
As such, with the metals looking to break higher soon, now is the time to consider making Gold, Silver and Platinum the cornerstone assets in your long-term wealth creation strategy.
Chart 4 Gold AUD
Chart 5 Silver AUD
This publication has been prepared for the GBA Group Companies. It is for education purposes only and should not be considered either general of personal advice. It does not consider any particular person’s investment objectives, financial situation, or needs. Accordingly, no recommendation (expressed or implied) or other information contained in this report should be acted upon without the appropriateness of that information having regard to those factors. You should assess whether or not the information contained herein is appropriate to your individual financial circumstances and goals before making an investment decision or seek the help the of a licensed financial adviser. Performance is historical; performance may vary; past performance is not necessarily indicative of future performance. Any prices, quotes or statistics included have been obtained from sources deemed to be reliable, but we do not guarantee their accuracy or completeness.
Share This Article
If you would like to stay informed about up to the minute pricing, market news and specials, subscribe here.