Did A Seasonal Buying Cycle Just Begin In Hard Assets?
Gold and Silver finished October with their worst monthly performances since 2008 and 2011, respectively.
This led to the precious metals complex reaching technically oversold conditions, which were reversed sharply higher last week.
The 16% drop in Crude Oil prices combined with lower US Treasury yields contributed to last week’s positive price action.
And even though last Friday’s US Non-Farm Payroll (NFP) report printed stronger than expected, hard assets held on to most of their gains, which could signal the start of a seasonal buying cycle for Gold, Silver and Platinum.
Physical Gold priced in USD hit a three-week high at $4150.00 and pushed the 30-Day Moving Average (30-DMA) for the first time since September 10th. The yellow metal finished the week 5.1% higher at $4070.00.
The daily Relative Strength Index (RSI) is 48.30, which is a neutral reading. Initial support is $4015.00, and resistance is just above $4165.00.
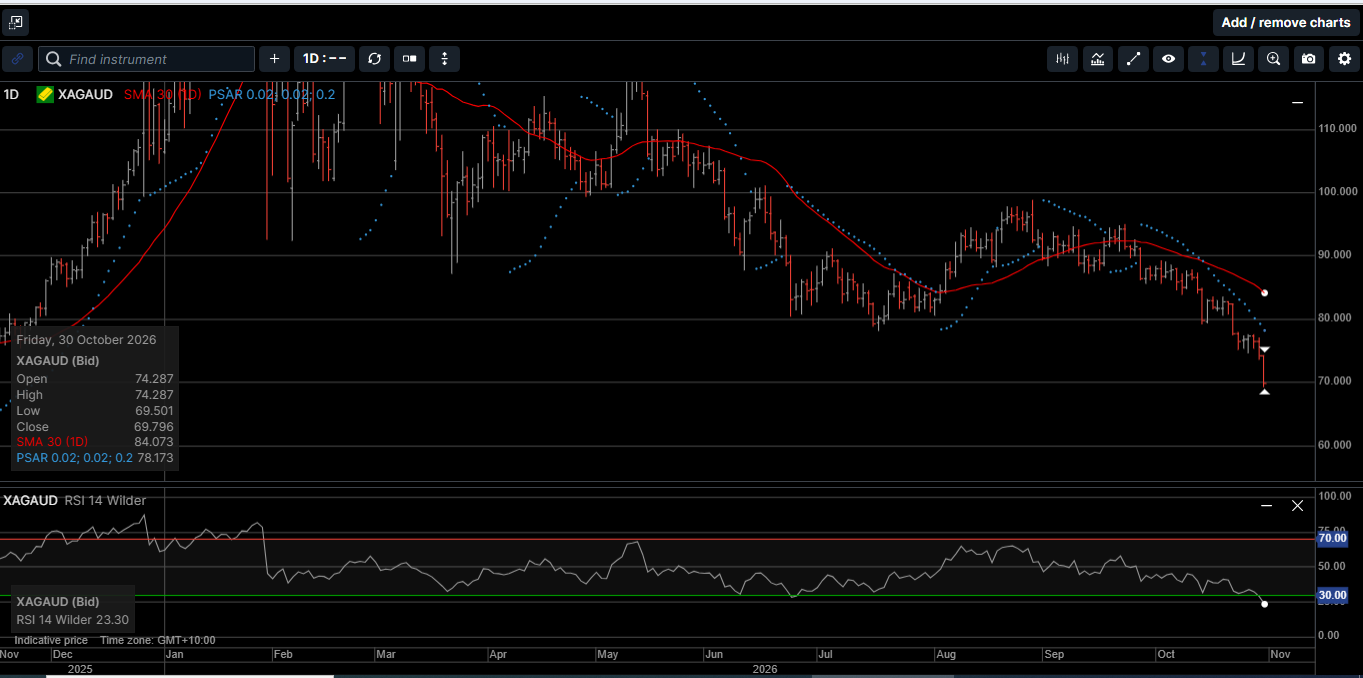
As shown on Chart 4, Gold denominated in AUD traded higher every day last week for a 7.6% gain with a solid close near the two-week high at $5924.00.
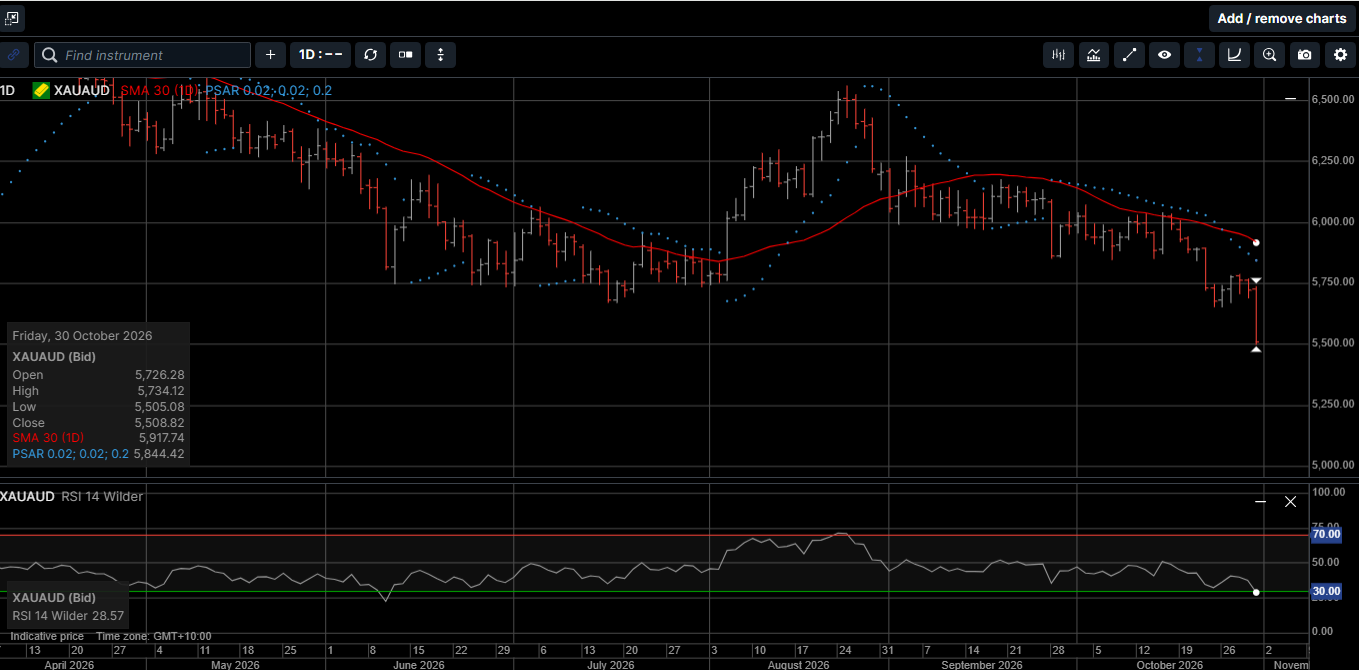
This is the first weekly close above the 30-DMA since September 4th, which combined with the 54.25 daily RSI, is a bullish technical pattern.
Physical Silver priced in USD posted a new low for the year at $48.60 before reversing higher to close out the week 5.8% higher at $51.95.
The daily RSI is 38.10, which is a neutral reading. Initial support is $50.50, and resistance is in the $53.60 to $53.80 range.
Silver denominated in AUD rallied four of the last five days and finished the week 8.3% higher at $75.60. The daily RSI is 41.25 and pointing higher.
Initial support is $72.20, and a daily close above $77.70 would improve the technical outlook.
The Gold verses Silver ratio closed fractionally lower in favor of Silver at 78.20, which means it takes 78.20 ounces of Silver to equal the price of one ounce of Gold.
The ratio has been in a high-level consolidation pattern for the last two weeks. When this pattern breaks lower, Silver will likely outperform Gold into the end of the year.
Physical Platinum slipped to a fresh low of the year at $1385.00 before reversing higher last Wednesday to finish the week 7.2% higher at $1535.00.
The daily RSI is 44.40 and pointing higher. Initial support is $1490.00, and the next upside target is the 30-DMA at $1610.00.
As mentioned above, the headline growth of NFP accelerated, the prior two months were revised higher; month-to-month growth in hourly earnings rose, and the unemployment rate edged down according to data from the Bureau of Labor Statistics last Friday.
Payrolls of Non-Farm employers jumped by 165,000 in October from September, and September’s gain was revised up by 31,000 and August’s gain was revised up by 53,000.
It’s important to mention that while all three back months were revised higher in this month’s NFP report, 80% of all revisions over the last 10 years have been lower.
The consensus expectation was for 65,000 new jobs for the month.
By that metric, Friday’s NFP report was stronger than expected.
But is the US labor market strong in absolute terms and relative to recent historical trends?
More importantly, will last Friday’s NFP report move the FED’s policy needle toward another rate hike in December?
As illustrated on Chart 1, compared to the period running from 2022 to the end of 2024, the growth in US payrolls is not strong and the six-month average gain of nonfarm payroll is rolling over and trending lower again.
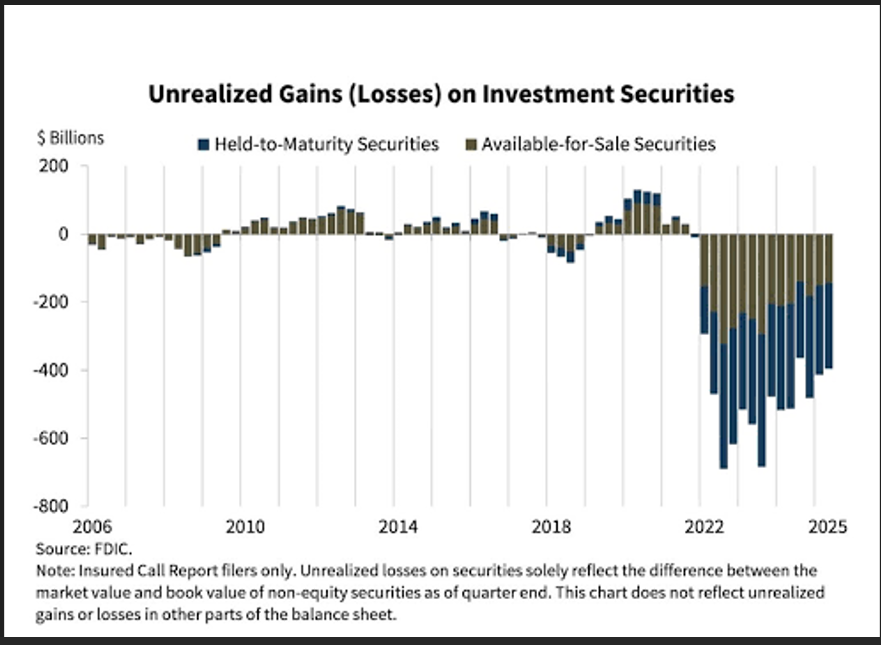
In addition, even though wage growth ticked slightly higher in last Friday’s NFP report, Chart 2 shows that the US Personal Savings Rate has been trending lower and has just reached a four-year low.
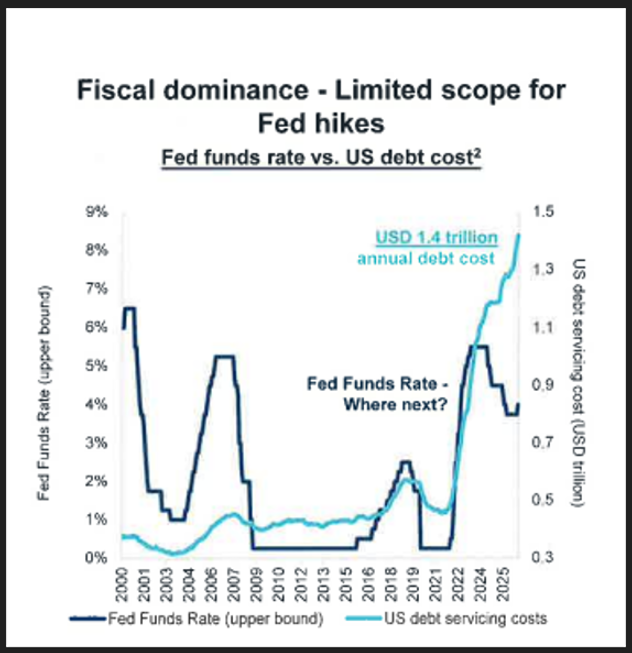
In short, there is no evidence that the US Labor market is overheating, contributing to consumer wage inflation, or in need of a FED tightening cycle to dampen financial conditions.
This does not mean that the FOMC will not raise the FED Funds rate by 25 basis points in December.
However, as shown on Chart 3, since hitting a 25-year high of 5.35% on October 5th, the yield on the US 10-year note has dropped by more than 10% to 4.80% last week.
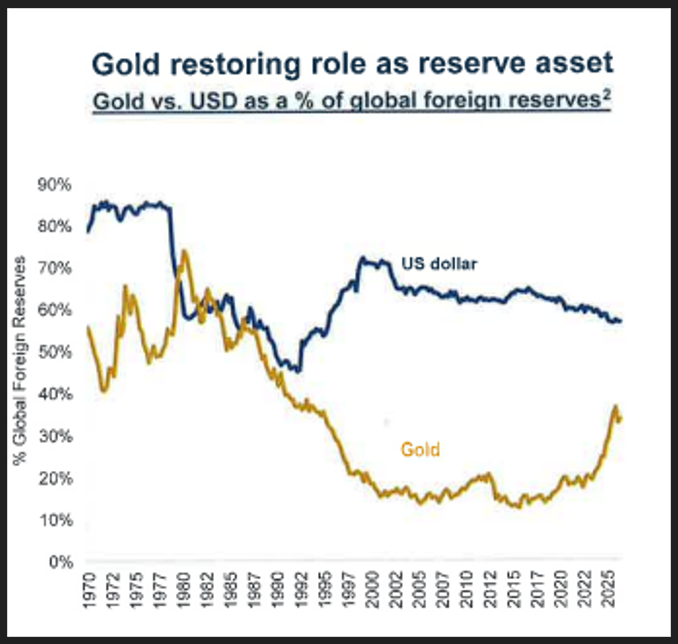
This is a strong signal that that institutional investors in the long end of the US treasury curve are not confident that economic conditions in the US are trending higher, and that at some point the FED will have to reverse gears and lower rates to stimulate growth.
Last week’s price action is evidence that the prospects of lower interest rates and a lower USD over a longer-term time horizon is bullish for hard assets.
Hard assets offer wealth security and have a proven, long term track record of being a safe haven investment during times of economic uncertainty, geopolitical instability and fiat currency debasement.
The precious metals were under pressure during October and have started November with a solid performance.
From a cyclical point of view, the last three months of the year are bullish for hard assets.
As such, now is the time to consider adding to your physical metal holdings and making Gold, Silver and Platinum the cornerstone assets in your long-term wealth creation strategy.
This publication has been prepared for the GBA Group Companies. It is for education purposes only and should not be considered either general of personal advice. It does not consider any particular person’s investment objectives, financial situation, or needs. Accordingly, no recommendation (expressed or implied) or other information contained in this report should be acted upon without the appropriateness of that information having regard to those factors. You should assess whether or not the information contained herein is appropriate to your individual financial circumstances and goals before making an investment decision or seek the help the of a licensed financial adviser. Performance is historical; performance may vary; past performance is not necessarily indicative of future performance. Any prices, quotes or statistics included have been obtained from sources deemed to be reliable, but we do not guarantee their accuracy or completeness.