Are Gold And Silver Back In The Buy Zone?
Last week was the end of September, as well as the end of the third quarter of 2026.
Even though last Friday’s US Non-Farm Payroll (NFP) report was weaker on every metric, the precious metals complex slipped into the lower part of recent ranges on end of quarter position adjustments.
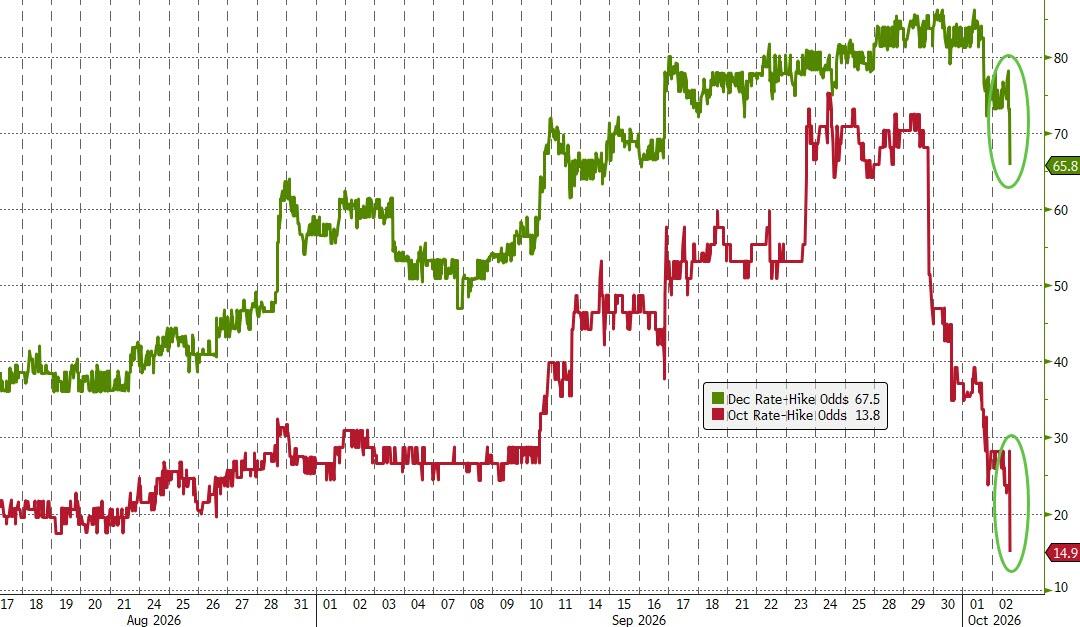
However, as illustrated on Chart 1, the soft employment numbers pushed the probability of a rate hike in October down to 13.8% , which is a positive fundamental signal for Gold, Silver, and Platinum prices.
Physical Gold priced in USD hit a two-month low at $4110.00 last Monday and finished the week 3.3% lower at $4140.00.
The daily Relative Strength Index (RSI) reached an oversold reading at 34.50. Initial support is at $4080.00, and a close above $4280 would turn momentum indicators back to positive.
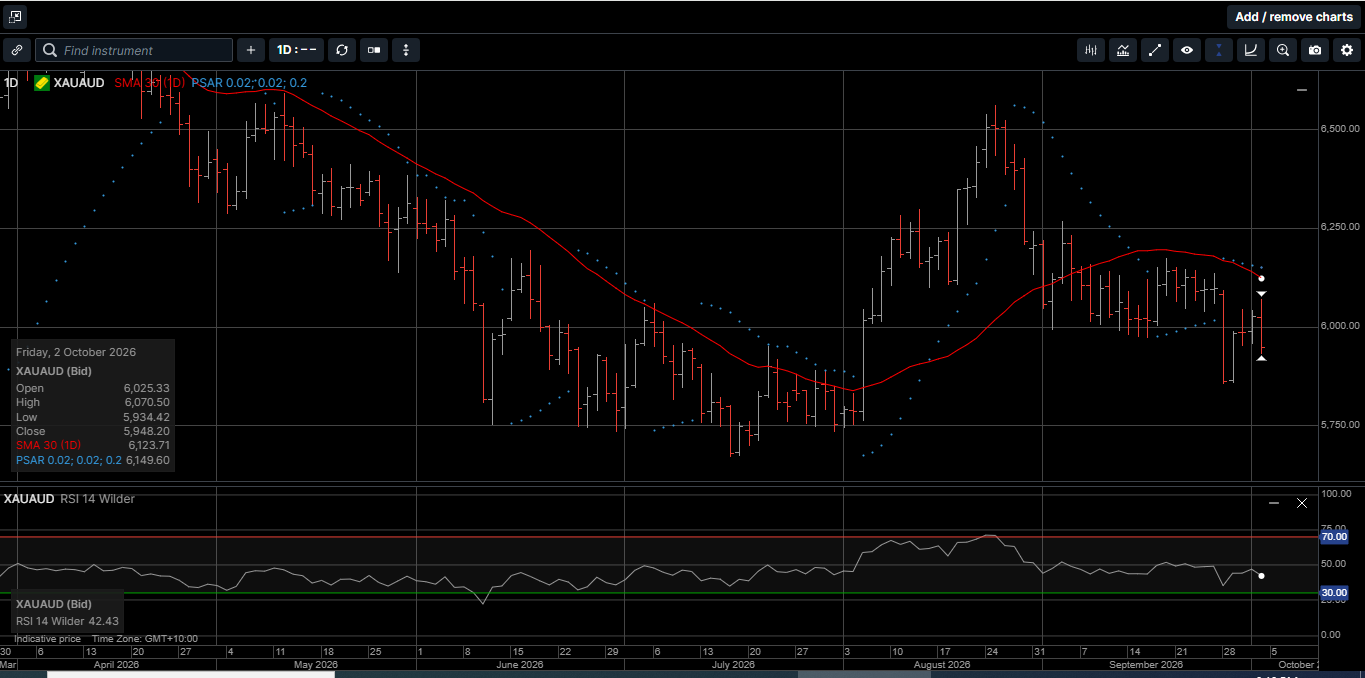
Gold denominated in AUD also hit a two-month low at $5860.00 and closed 2.4% lower at $5950.00.
The daily RSI dipped to 35.00 on Monday but recovered to a neutral reading at 42.40. Initial support is $5800.00, and resistance is in the $6120.00 to $6150.00 area.
Physical Silver priced in USD dipped below $60.00 for the first time since early August before recovering to close out the week 6.1% lower at $60.45.
The daily RSI is near oversold territory at 38.50. Initial support is $60.00, and a close above $64.10 would improve the technical outlook.
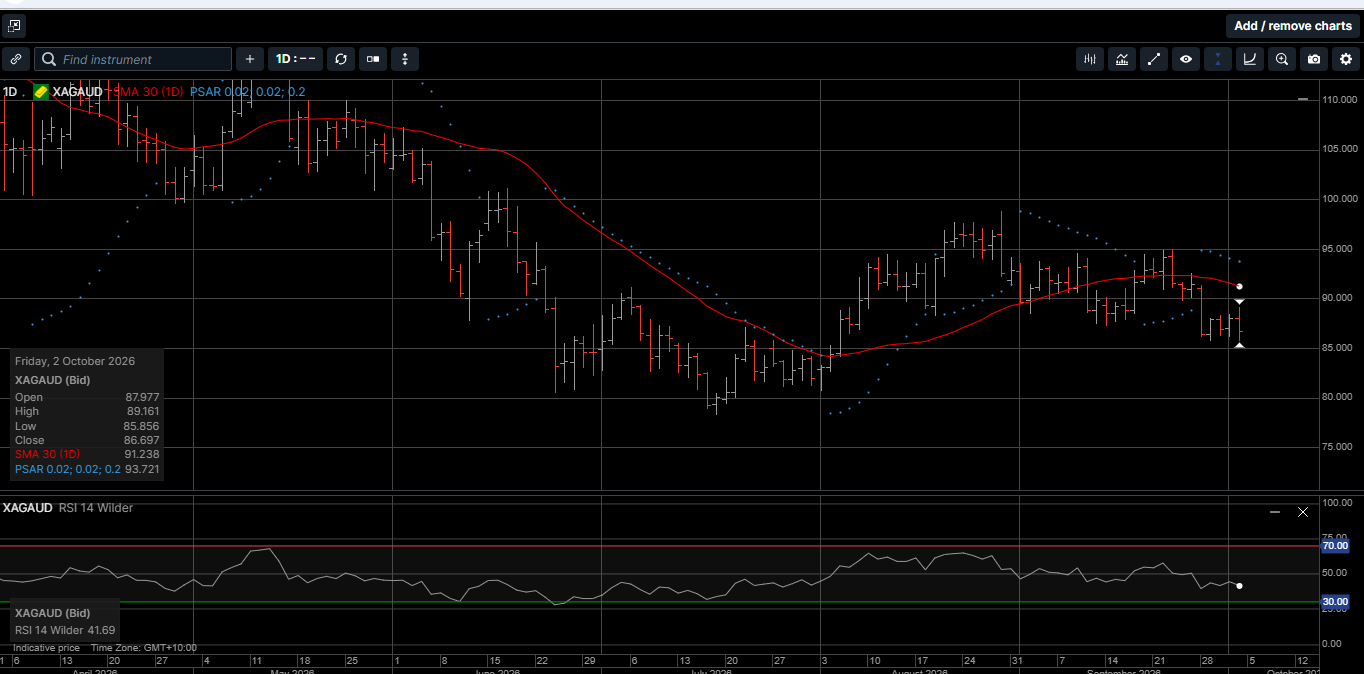
Silver denominated in AUD fell 5.2% to close out the week at $86.50.
The daily RSI is showing a neutral reading at 42.00. Initial support is $85.10, and a daily close above $91.25 would turn internal momentum indicators back to positive.
The Gold versus Silver ratio rose 2.8% in favor of Gold to close at 68.50, which means it takes 68.50 ounces of Silver to equal the price of one ounce of Gold. The ratio is in the upper end of the six-month range between 70.00 and 63.00, which suggests a reversal lower is likely.
Physical Platinum hit a four-week low at $1675.00 before rising slightly to close out the week down 4.5% at $1700.00.
The daily RSI is 41.25. The $1675.00 level looks to be a double bottom and a close above $1780.00 would suggest a durable low is in place.
As shown on chart 2, the September jobs report was much weaker than expected, with just 29,000 jobs added, well below the 90,000 consensus and the August number was 133,000, which was revised down from 162,000.
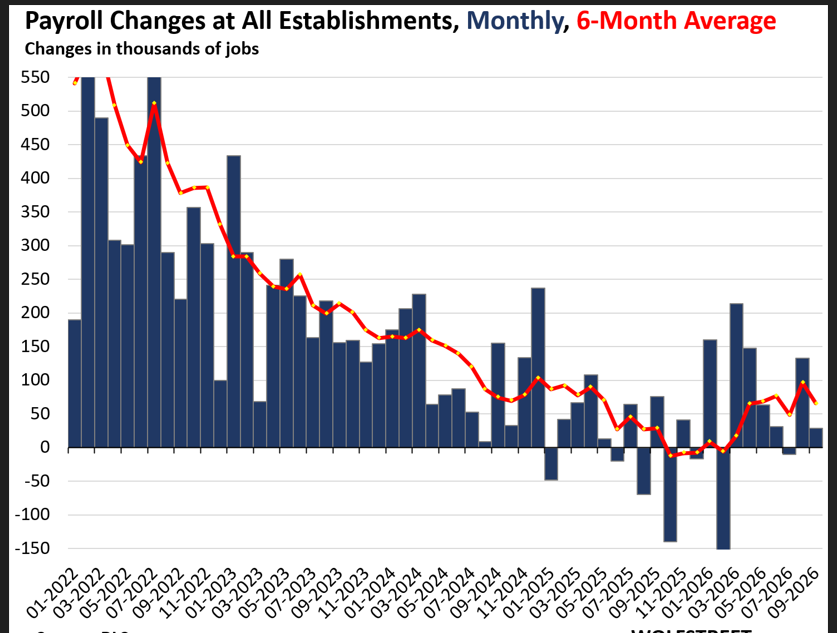
The net revision to July and August payrolls was -60,000, suggesting that the US labor market is not as strong as initially thought, and favorable seasonal dynamics may have distorted the August jobs numbers.
The unemployment rate ticked up to 4.2% from 4.1%, alongside an increase in the participation rate to 61.8% from 61.6%.
On balance, the weak headline payroll growth, rise in unemployment and negative revisions to the number of jobs will add to concerns for the FED about the health of the American labor market.
It is worth noting that FED officials seem to be more focused on the inflation side of their dual mandate, which means the Consumer Inflation reports released next week could shape the central bank’s policy rhetoric, if not their actions.
Nonetheless, last Friday’s report likely cements expectations for an October pause in the FED Funds rate, particularly following the softer August core PCE data and calls for patience from several voting FED governors.
From a longer-term perspective, the surge in US treasury yields is beginning to show signs of fatigue. This topping of rates is even more apparent in the bond yields of other developed economies.
For example, as shown on Chart 3, Since 2022, Japanese yields have increased by four-fold across the curve, which means investors holding Japanese bonds have lost billions over the last four years.
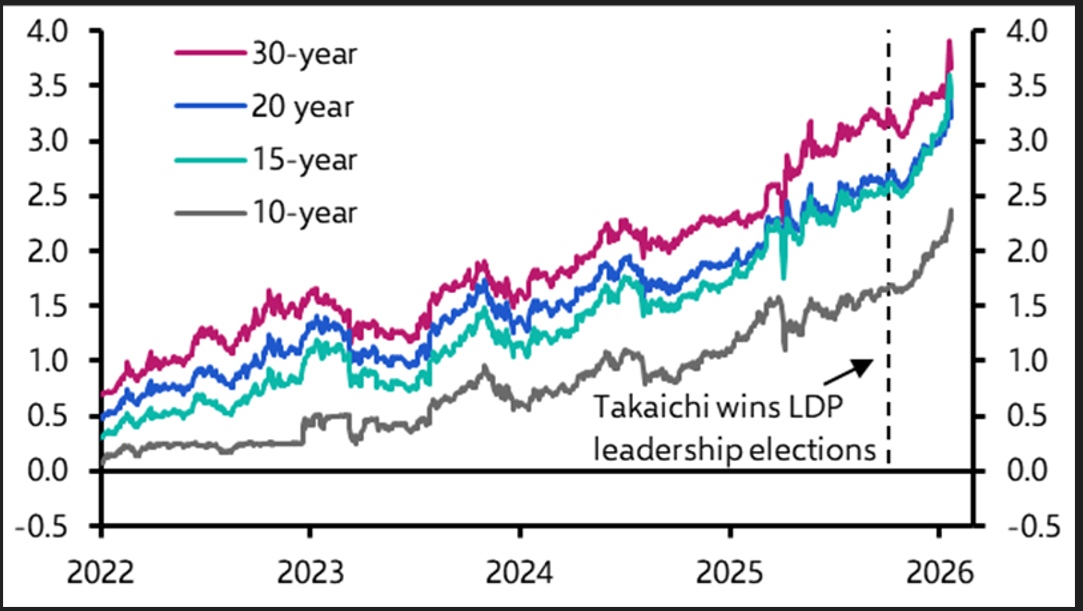
Large and growing losses for bond holders is a worldwide pricing dynamic as yields climb higher when investors demand more return to cover the risk of soaring government deficits and currency debasement.
This is why central banks and provident investors are turning to hard assets as a store of value, to preserve the purchasing power, and to secure long-term generational wealth.
Throughout history, hard assets represent the purest form of money during times of economic turbulence without the risk of government default or bankruptcy.
As such, now is the time to consider adding to your hard asset holdings and making Gold, Silver and Platinum the cornerstone assets in your long-term wealth creation strategy.
This publication has been prepared for the GBA Group Companies. It is for education purposes only and should not be considered either general of personal advice. It does not consider any particular person’s investment objectives, financial situation, or needs. Accordingly, no recommendation (expressed or implied) or other information contained in this report should be acted upon without the appropriateness of that information having regard to those factors. You should assess whether or not the information contained herein is appropriate to your individual financial circumstances and goals before making an investment decision or seek the help the of a licensed financial adviser. Performance is historical; performance may vary; past performance is not necessarily indicative of future performance. Any prices, quotes or statistics included have been obtained from sources deemed to be reliable, but we do not guarantee their accuracy or completeness.