A Strong Technical Breakout For Gold And Silver
Reports of a cooling US Employment market combined with a 10% drop in Crude Oil prices lifted the precious metals complex out of their two-month consolidation pattern last week.
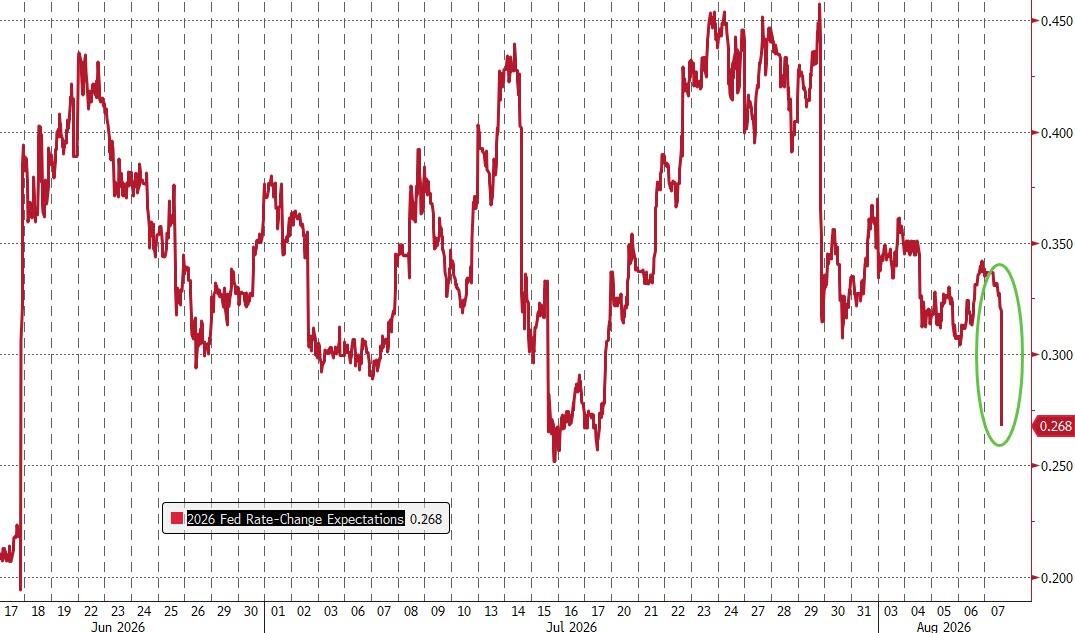
As illustrated above on Chart 1, the fall in rate hike expectations inspired broad-based buying, which drove Gold, Silver and Platinum prices to their strongest weekly gains since January.
The macro data highlight for this week will be the US consumer and producer inflation reports. At this point, the consensus forecast is pointing to softer readings.
If this is the case, it will be difficult to rebuild expectations for a FED rate hike by next month’s FOMC meeting, which is bullish for hard assets.
Physical Gold priced in USD posted a two-month high at $4371.00 and finished the week 7.4% higher at $4341.00. This represents the first weekly close above the 30-Day Moving Average (30-DMA) since April 17th.
The daily Relative Strength Index (RSI) is 65.40 and pointing higher, which suggests potential range extension into the $4470.00 area, with initial support near $4240.00.
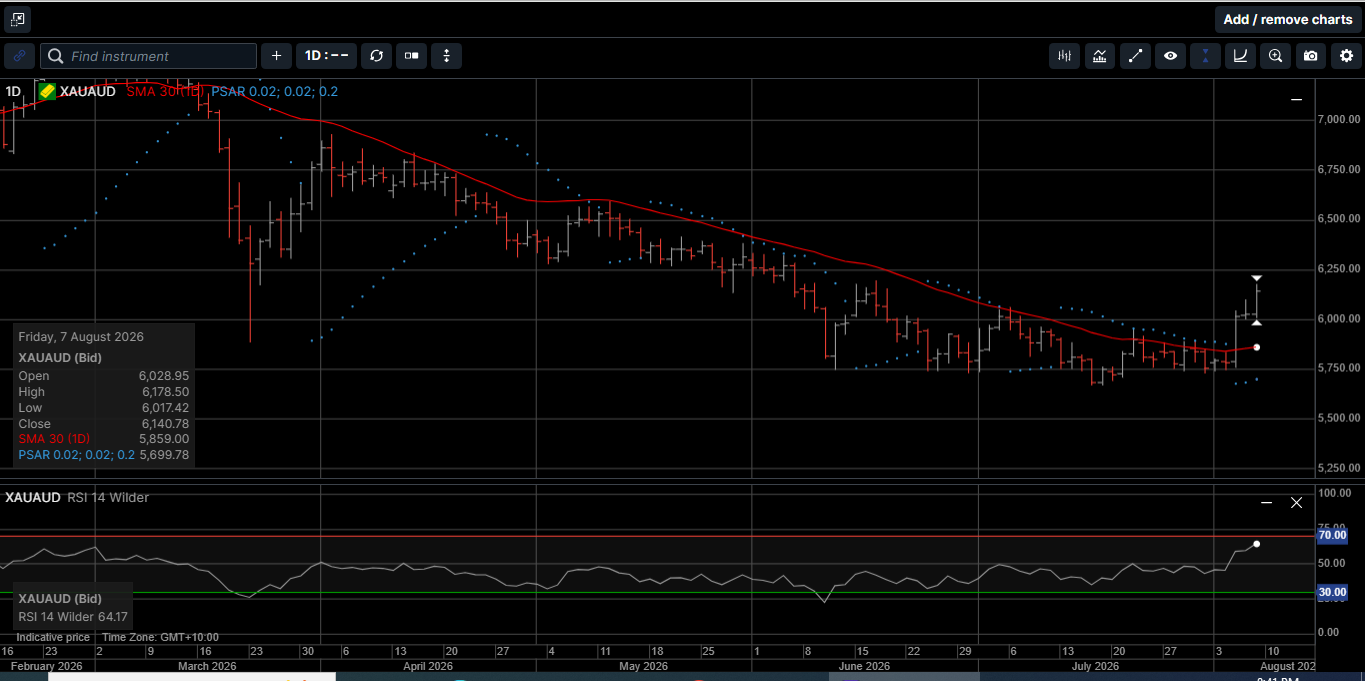
Gold denominated in AUD reached a six-week high at $6178.00 on the way to a 6.7% weekly gain and settled in the high end of the range at $6140.00.
This is the first weekly close above the 30-DMA since March 13th. The daily RSI is 64.20, which is well below an overbought reading. Initial support is near $5890.00, with chart resistance at $6310.00.
Physical Silver priced in USD soared to a five-week high at $65.15 before drifting lower to close out the week 10.3% higher at $63.55.
This is the first weekly close above the 30-DMA since May 8th. The daily RSI is 59.60 and pointing higher, which suggests the upper end of the $67.00 handle is now a reasonable target with initial support near $61.25
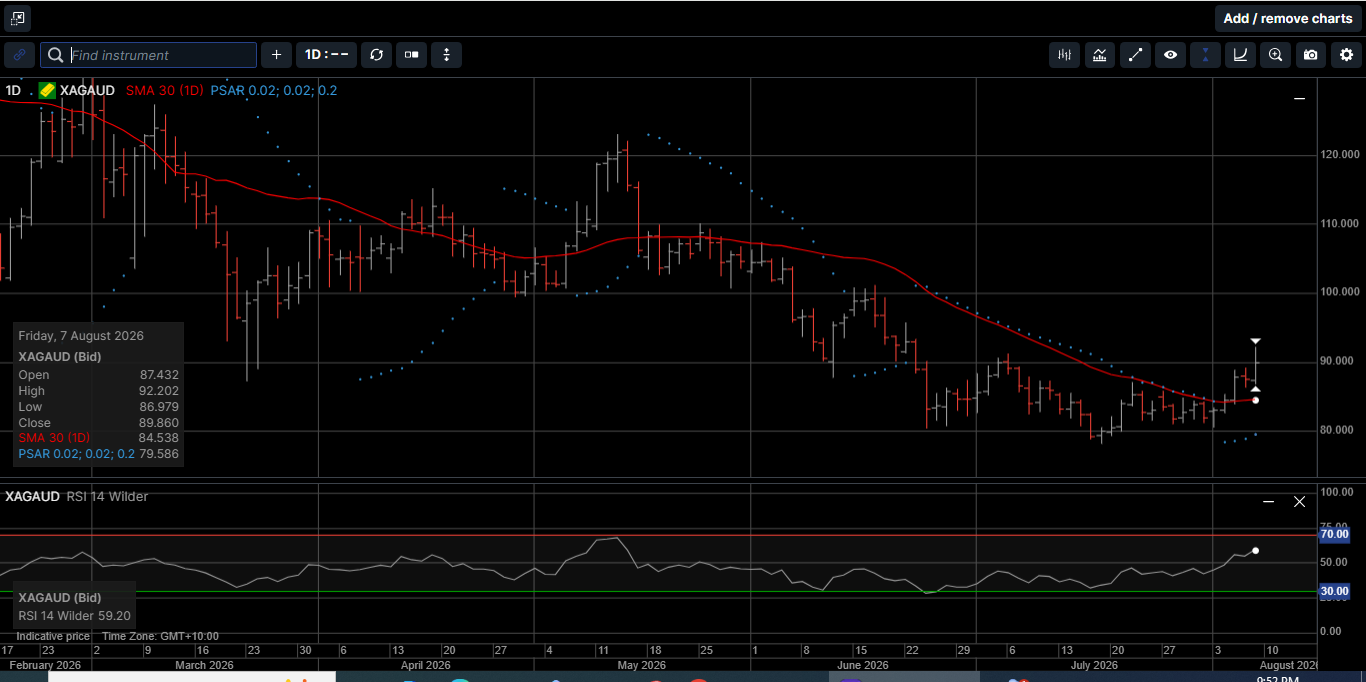
Silver denominated in AUD hit a six-week high at $92.20 on Friday before slipping lower to close up 9.6% for the week at $89.85.
This is the first weekly close above the 30-DMA since May 8th. The daily RSI is 59.20 and pointing higher, which now points to the $95.00 handle, with initial support near $85.75.
The Gold versus Silver ratio fell 2.6% in favor of Silver and closed at 68.20. That means it takes 68.20 ounces of Silver to equal the price of one ounce of Gold.
The technical momentum indicators are pointing lower, which makes the 62.00 handle a reasonable downside target over the medium term.
Physical Platinum posted a six-week high at $1788.00 on the way to a weekly gain of 6.3% and closed at $1746.
The daily RSI is 61.00 which is not overbought. There is a triple top resistance area on the daily charts between $1785 and $1790. A break above that level could see an upside range extension to the mid-June highs between $1820.00 and $1825.00.
As mentioned above, last week’s US Employment data can be described comprehensively dismal.
Wednesday’s ADP Payroll report showed 44,000 new jobs created, against expectations of 68,000, Friday’s headline Non-Farm Payroll number was 23,000 jobs LOST versus expectations of 85,000 new jobs created.
To make the report worse, the June payroll number was revised from 57,000 down to 20,000 new jobs.
And finally, local government jobs plunged by 57,000, the biggest month-to-month drop of local government jobs in seven years.
As if the softer employment outlook wasn’t enough to weaken the USD and rally the precious metals, in an unexpected throwback to the 1990s, last Wednesday, the US Treasury directed the New York FED to sell Euros and purchase Japanese Yen, marking the first outright Yen-buying intervention by the US since 1998.
At the time, the USD/JPY was trading at 164.00, a 40 year low against the USD.
Tokyo’s Ministry of Finance (MoF) had already entered the market to buy Yen earlier, and Washington’s involvement via the Foreign and International Monetary Authorities Repo Facility (FIMA) turned the move into a full joint operation.
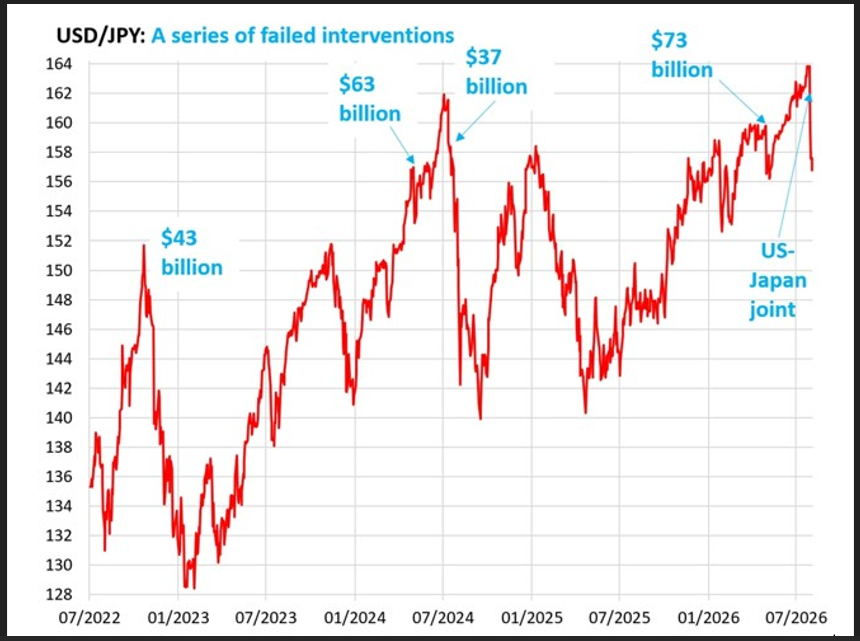
As shown on Chart 2, traders responded immediately: the USD/JPY fell to 155.25 by Friday’s close, while the USD Index slipped below the psychologically significant level of 100
The coordinated action reflects the growing concerns central banks have about extreme currency swings, and how willing they remain to intervene directly in currency markets.
It is estimated that the MoF spent up to $65 billion, and the US sold around $25 billion worth of Euros to support the Yen.
So, why did the US Treasury use FIMA, a COVID-era emergency liquidity facility, to sell Euros to help the MoF stabilize the Yen?
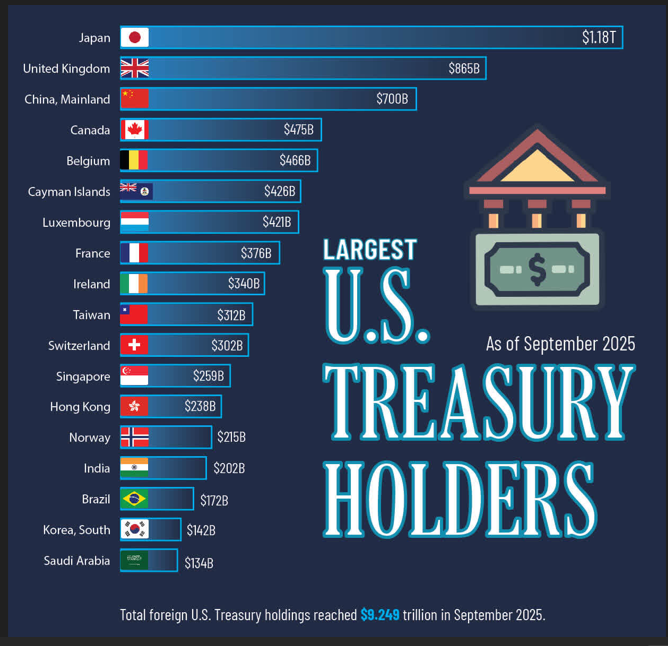
As shown on Chart 3, Japan holds close to $1.2 trillion in US Treasury bonds, most of which have lost value as long-term yields have risen over the last six months.
We imagine that one of the US administration’s biggest fears would be if the Japanese government started dumping US Treasury paper to raise USD so they could stabilize their currency.
This would raise US rates further and increase the US government’s borrowing costs.
Unfortunately, as shown on Chart 2, history offers little encouragement that last week’s intervention is going to have a long-term positive effect on the Yen, or be the last joint intervention.
The last joint U.S.-Japan Yen-buying operation took place on June 17th, 1998, and within months the dollar had regained most of its losses.
Last Wednesday, during the intervention, physical Gold moved nearly $170.00 higher, and Silver rose by over $2.50 intraday.
Gold and Silver’s quick advance during the NY session suggests that when governments intervene more heavily in currency markets, provident investors continue to prefer the certainty of a time proven store of value, rather than promises of a decisive bail out policy.
In short, last week’s $90 billion joint intervention underscores the risk of holding fiat currency as a primary investment asset.
Hard assets offer stability, liquidity, and a high level of wealth security.
Last week’s rally in the precious metals complex broke above several key technical levels and may be building momentum for a larger move higher.
As such, now is the time to consider reducing your paper asset exposure and increasing the holdings of Gold, Silver, and Platinum in your long-term wealth creation strategy.
This publication has been prepared for the GBA Group Companies. It is for education purposes only and should not be considered either general of personal advice. It does not consider any particular person’s investment objectives, financial situation, or needs. Accordingly, no recommendation (expressed or implied) or other information contained in this report should be acted upon without the appropriateness of that information having regard to those factors. You should assess whether or not the information contained herein is appropriate to your individual financial circumstances and goals before making an investment decision or seek the help the of a licensed financial adviser. Performance is historical; performance may vary; past performance is not necessarily indicative of future performance. Any prices, quotes or statistics included have been obtained from sources deemed to be reliable, but we do not guarantee their accuracy or completeness.