Metals Rebound on Split FOMC Decision
by Joel Cameron
Posted on 5 May, 2026 in
From a market impact perspective, developments in the Middle East remain unpredictable.
As such, the precious metals complex turned to incoming macro data and last week’s FOMC meeting for direction.
The FOMC surprised nobody by holding the FED FUNDS rate unchanged on a split vote of 8 to 4, which was the most divided vote in 34 years.
After a quick dip lower early in the week, Gold, Silver and Platinum prices found safe-haven bids and traded higher and into recent accumulation phase ranges.
Physical Gold priced in USD slipped 2.1% to finish the week at $4615.00. The yellow metal closed below its 30-Day Moving Average (30-DMA) every day last week.
Strong support appears to be building in the $4500.00 area, and a close above $4790.00 would improve the technical outlook.
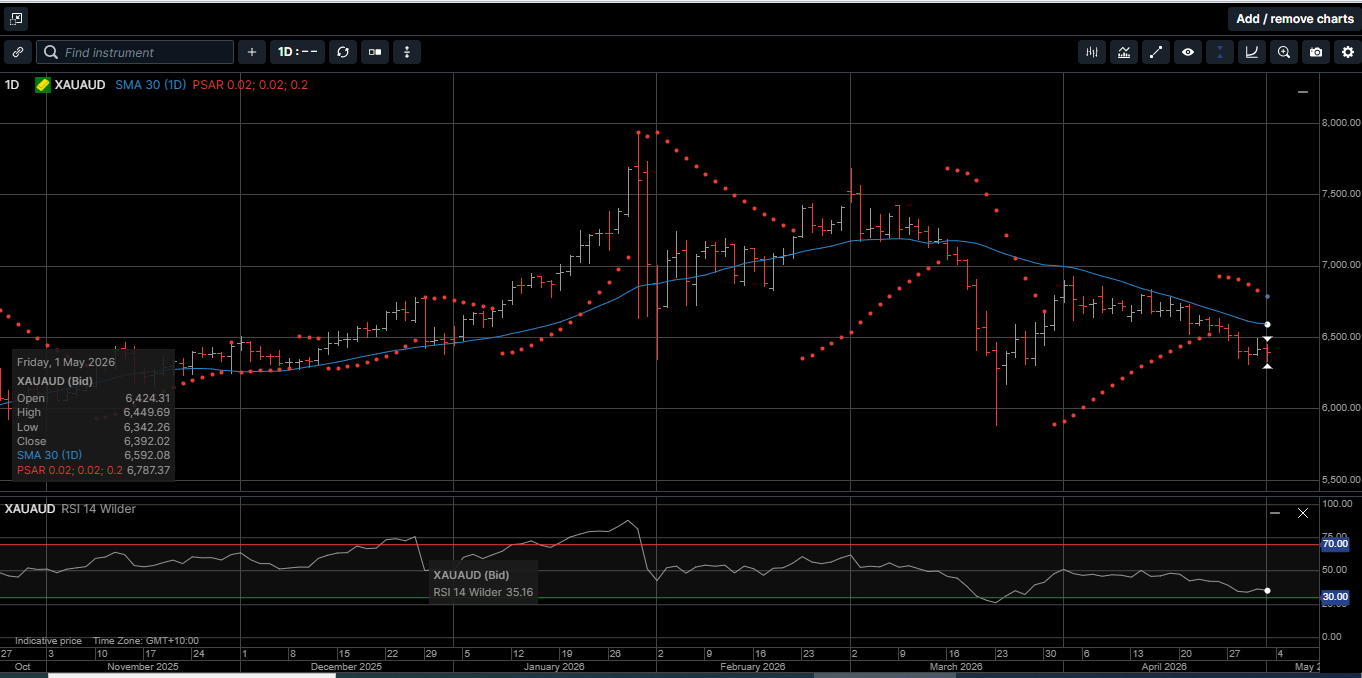
Gold denominated in AUD fell 2.8% and closed the week at $6392.00.
AUD Gold looks technically positive even though it has remained below its 30-DMA since mid-March. The rally in the AUD/USD continues to cap prices.
Physical Silver priced in USD finished the week fractionally lower at $75.35 and just above its 30-DMA at $75.10.
We see solid chart support at $71.70 and an upside pivot level near $79.00.
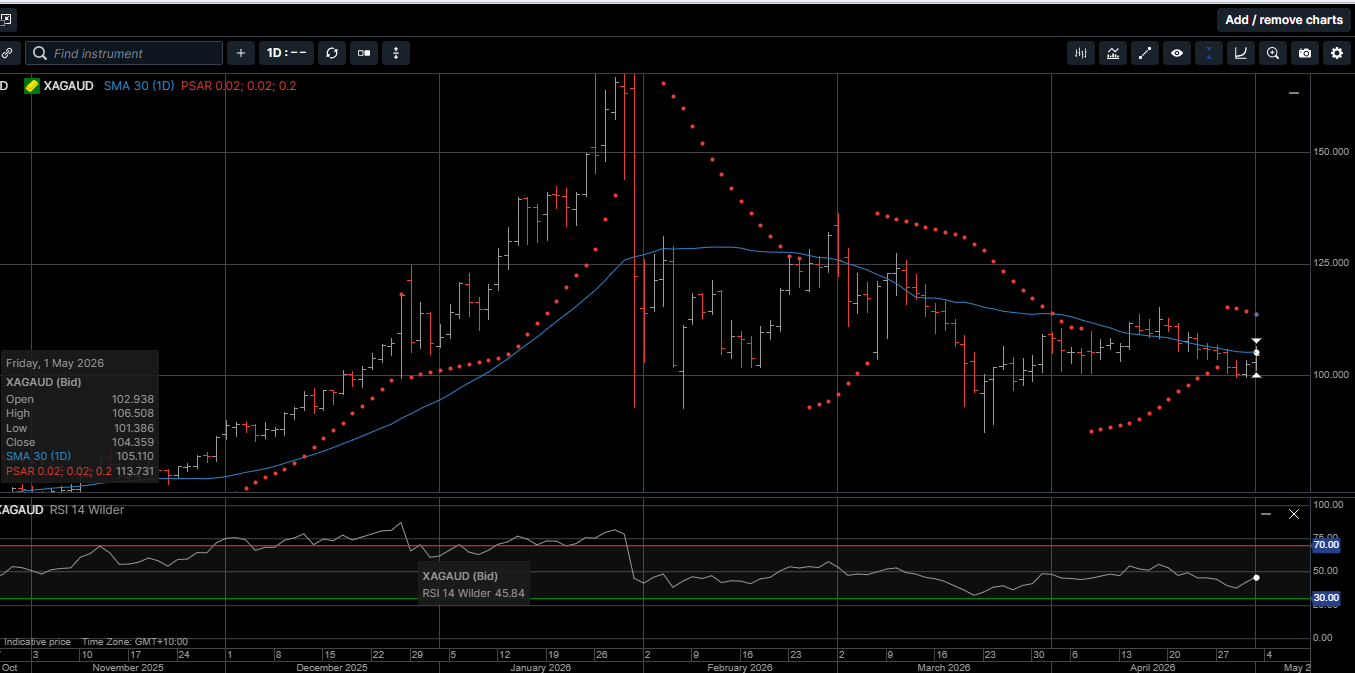
Silver denominated in AUD finished the week 1.3% lower at $104.35. AUD Silver traded on both sides of its 30-DMA last week as upside momentum continues to build.
We see solid chart support near the double bottom level near $99.70.
The Gold versus Silver ratio dropped 1.3% in favor of Silver to close at 61.10. That means it takes 61.10 ounces of Silver to equal the price of one ounce of Gold.
Physical Platinum slid 1.2% lower and closed the week just above its 30-DMA at $1988.00.
The daily chart looks to be forming a flag pattern bound by $1850 support and a pivot point above the market at $2105.00.
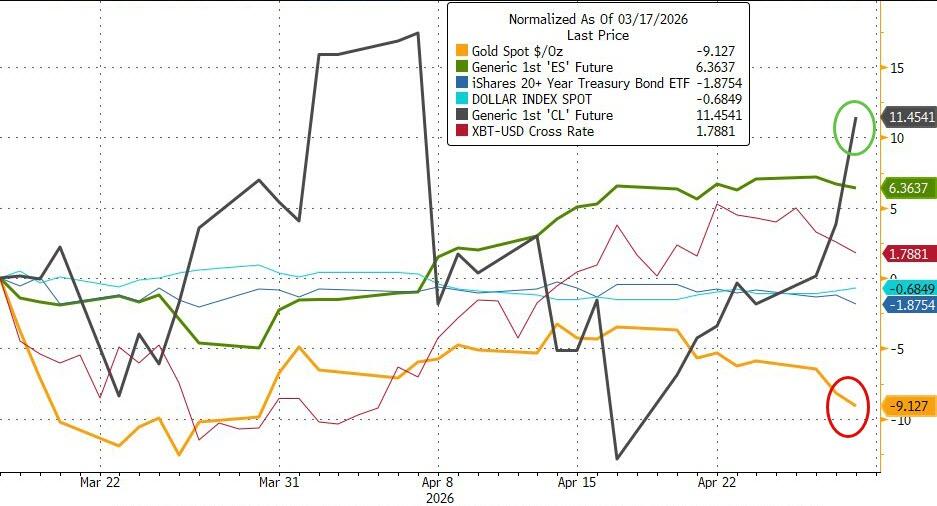
As illustrated on Chart 1, since the last FOMC meeting on March 18, physical Gold is 9.1% lower while the S&P 500 and crude oil have risen by 6.3% and 11.4%, respectively.
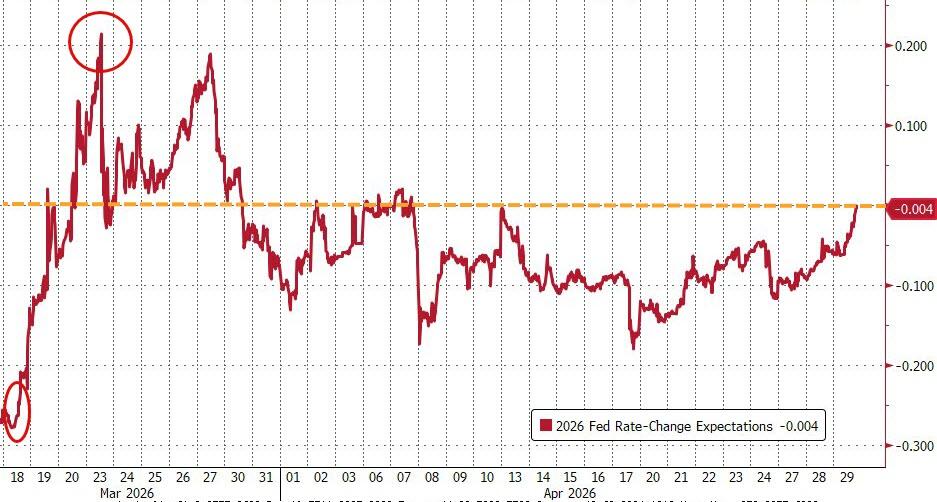
During that time, as shown on Chart 2, FED rate-change expectations have seen wide swings from a full rate-cut to a full rate-hikeand have now fallen back to pretty much no change at all in 2026.
On the macro front, The FED’s dual mandate is in play as core inflation has risen modestly for now, while GDP growth and employment have surprised the upside.
Realistically, the FED doesn’t need to cut rates for monetary policy to get easier.
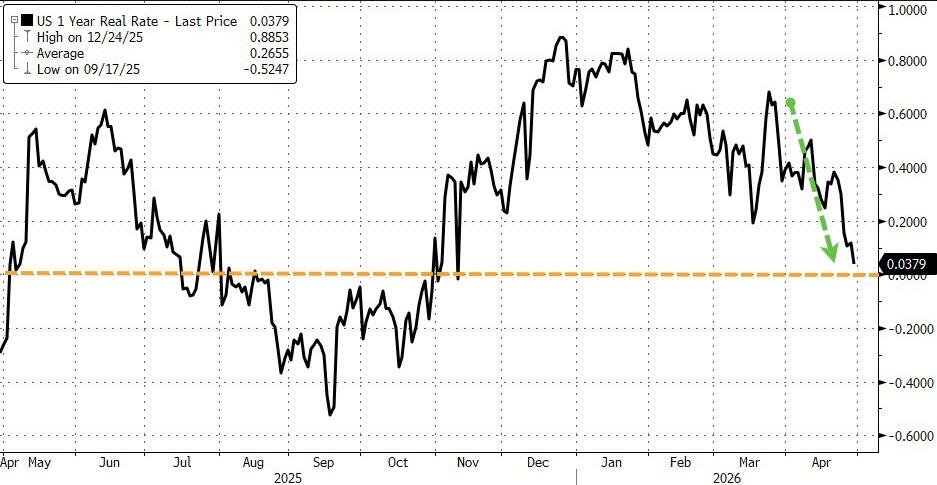
As shown on Chart 3, inflation expectations are rising enough that real rates have fallen to the lowest level since November of last year and are close to turning negative.
Real rates are calculated by taking the 1-yr bond yield and subtracting the inflation rate.
In this case, 3.718% 1-yr yield minus 3.40% inflation.
It is worth noting that the lagging inflation numbers do not currently reflect the higher energy prices as a result of the Persian Gulf conflict.
In that respect, US real interest rates could already be negative.
This is a big problem for the FED since they can only influence short-term interest rates via the FED Funds rate.
And as inflation chips away at the yield in the longer end of the curve, the problem gets acutely worse.
Who would want to tie up their money buying US 10-yr or 30-yr bonds with an effective real yield of less than 2% ?
This is how the US funds its deficit, and it has been a long-term problem which is not getting any better.
Global central banks have seen this coming, which is why they have been buying tons of physical Gold at a record pace over the last four years.
Even Wall Street wire houses are now recommending that investors change the long held 60/40 stocks to bonds weighting, to a 60/20/20 portfolio mix to include 20% of precious metals.
Last week’s price action reflects the consistent investor’s appetite for buying safe-haven assets on price pullbacks.
The rebound off the lows early in the week underscores the continued appeal of hard assets amid a backdrop of persistent macroeconomic uncertainty, shifting monetary policy expectations, and amplified geopolitical tensions that show no signs of easing.
The precious metals complex offers wealth security and a time-proven store of value.
Now is the time to consider making physical Gold, Silver and Platinum the cornerstone assets in your long-term generational wealth strategy.
This publication has been prepared for the GBA Group Companies. It is for education purposes only and should not be considered either general of personal advice. It does not consider any particular person’s investment objectives, financial situation, or needs. Accordingly, no recommendation (expressed or implied) or other information contained in this report should be acted upon without the appropriateness of that information having regard to those factors. You should assess whether or not the information contained herein is appropriate to your individual financial circumstances and goals before making an investment decision or seek the help the of a licensed financial adviser. Performance is historical; performance may vary; past performance is not necessarily indicative of future performance. Any prices, quotes or statistics included have been obtained from sources deemed to be reliable, but we do not guarantee their accuracy or completeness.