Metals Rebound On Strong Demand
The dominant driver in last week’s market volatility was the Crude Oil versus Interest Rate Cut narrative.
The “cause and effect” logic is that the recent inflationary impact of rising energy prices will prevent the US FED, and other central banks, from lowering nominal interest rates over the course of the year.
This sudden flip of policy expectations has been a negative for the precious metals complex.
In actuality, an inflationary spike lowers the level of real interest rates, which is bullish for hard assets.
This dynamic was clearly illustrated during the second half of last week as Gold, Silver and Platinum prices staged strong upside reversals off technical support levels.
Physical Gold hit a four-month low at $4098.00 before finding a bid and recovering to close the week fractionally higher at $4493.00.
At its weakest point, the yellow metal was down almost 9.00% and had a 12.2% weekly trading range from bottom to top. The $4100.00 level looks like a durable low, but a break of $4600.00 is needed to improve the technical tone.
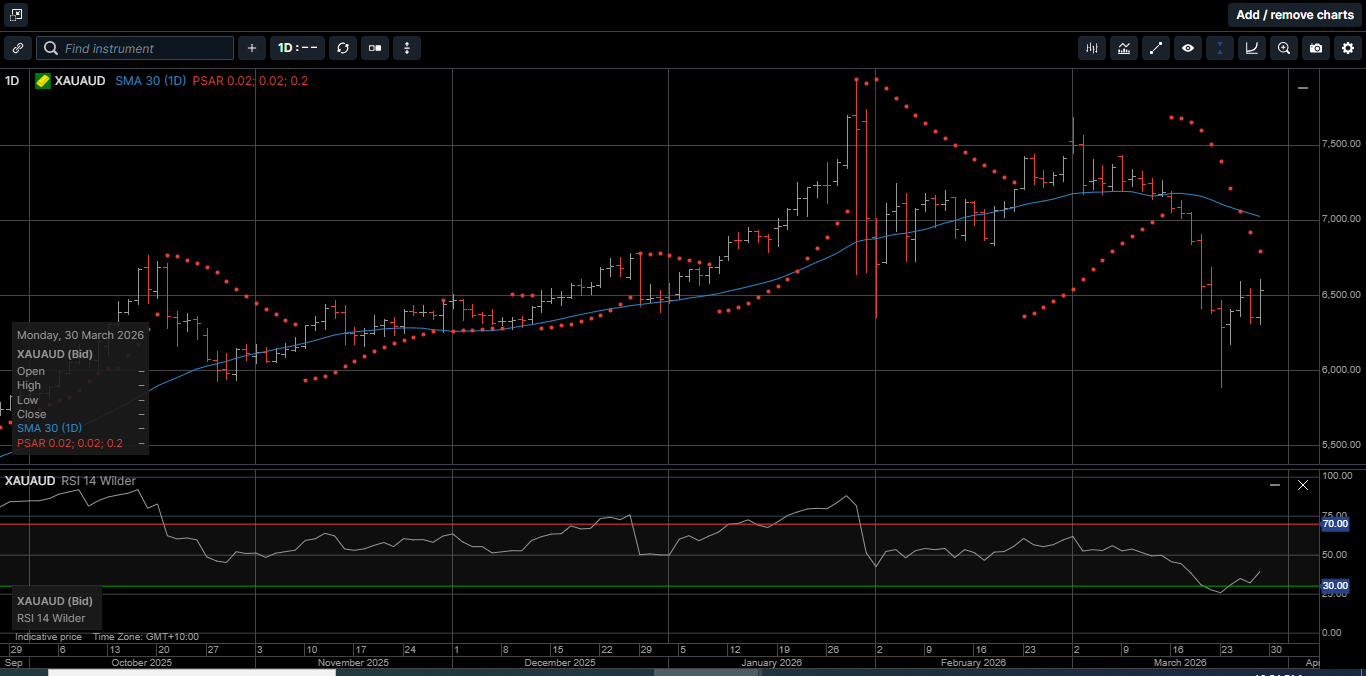
Gold denominated in AUD got a boost from the 2.1% drop in the AUD/USD to finish a volatile week 1.8% higher at $6529.00.
AUD Gold traded in a $715.00 weekly range, which pencils out to 12.1% from the weekly low to the weekly high. We see a key resistance level at $6780.00, which may come into play this week.
Physical Silver fell over 10.0% to a 4.5 month low at $60.95 last Tuesday and then rallied to close out the week 2.7% higher at $69.70.
The weekly range was 22.3% from high to low, which reflects a high level of volatility. We see firm support in the $61.00 area and resistance just above $79.00.
Silver denominated in AUD hit a four-month low at $87.50 last Tuesday before recovering to close out the week 5.2% higher at $101.65.
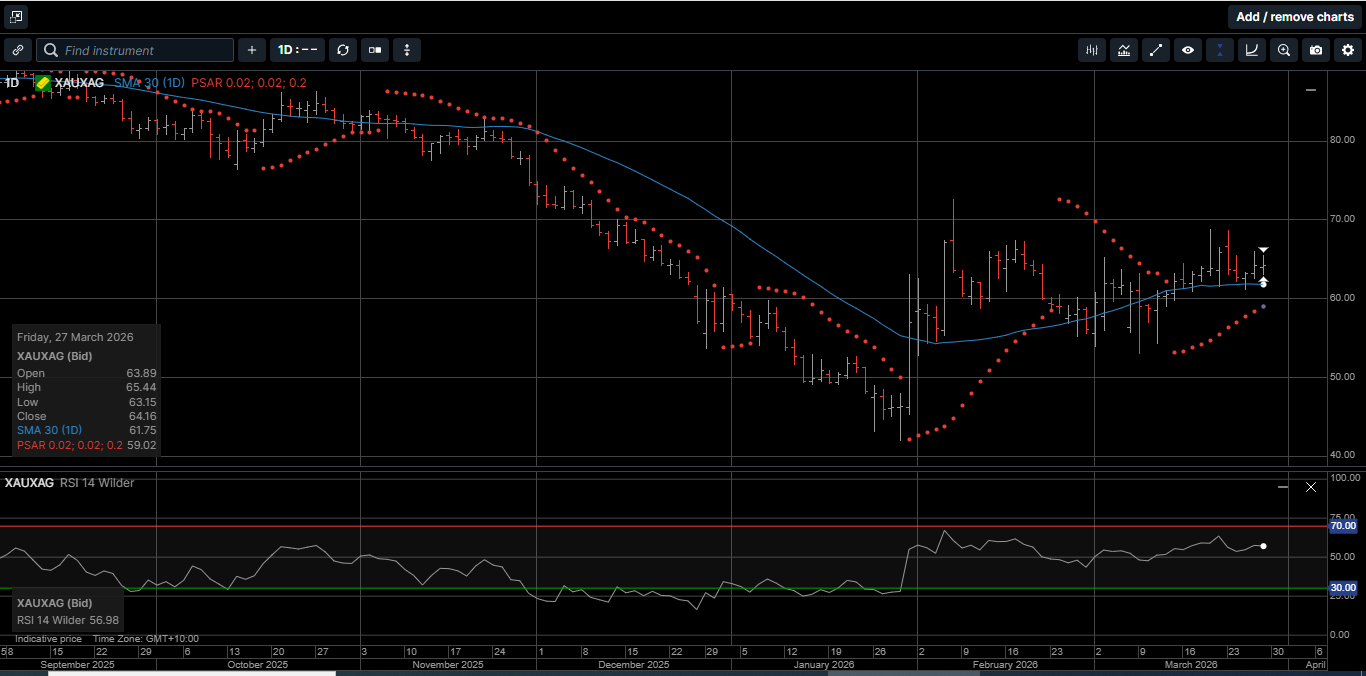
The Gold versus Silver ratio fell 2.6% in favor of Silver to close at 64.20. This means it takes 64.20 ounces of Silver to equal the price of one ounce of Gold.
Physical Platinum was down 9.8% at $1732.00 in early trade last Tuesday before paring the losses to close out the week 3.1% lower at $1861.00.
Like the other metals, Platinum traded in a broad 15.2% weekly range and looks to be building upside momentum. A close above $1955.00 would turn daily momentum indicators back to bullish.
One of the market fundamentals that keep investors flocking to the safe haven of the precious metals is the rising levels of global government debt.
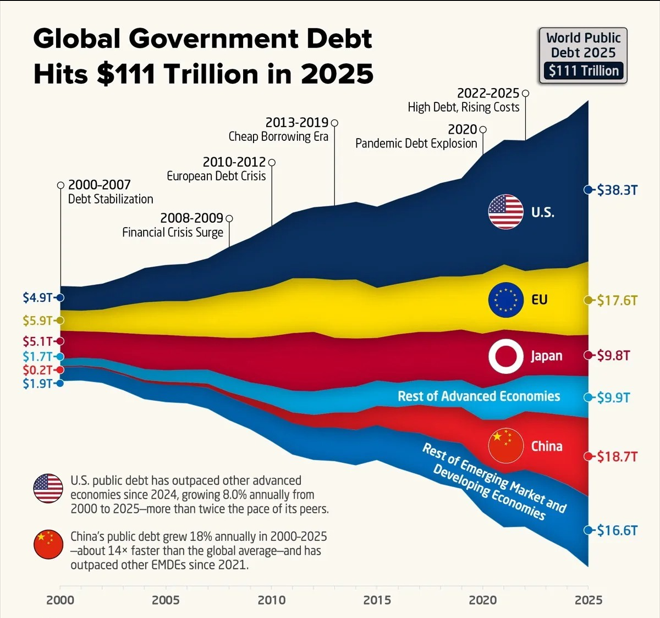
As illustrated on Chart 1, the growth of global debt just since the year 2000 is truly staggering and even eclipsed $111 trillion in 2025.
We understand that the interest rate swaps markets have priced out rate cuts due to concerns that the conflict in the Middle East may expand throughout the region and push energy prices higher for longer.
However, it is our view that the sheer weight of servicing these massive government debts will force developed central banks back to an easing posture over the next few months, which is bullish for the precious metals complex.
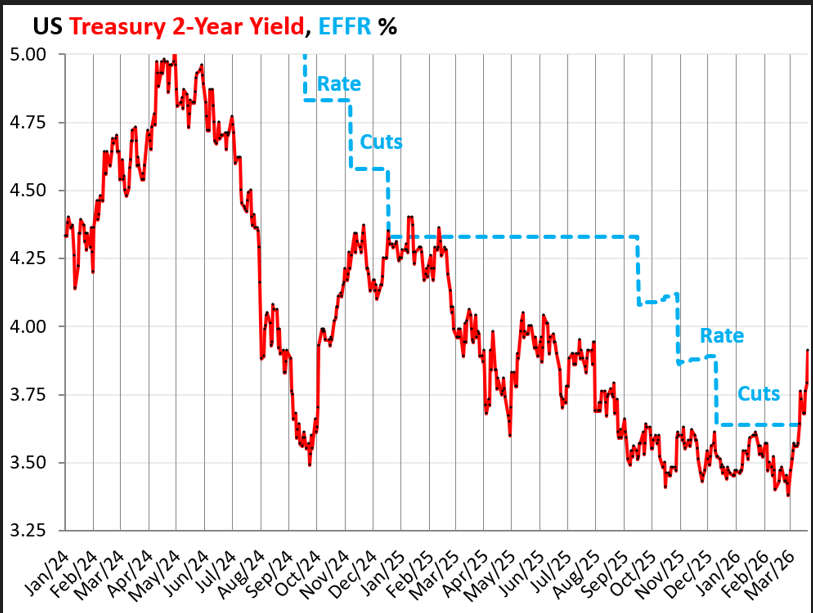
For example, as shown on Chart 2, the yield of the US Two-year Treasury note has pretty much tracked the US FED Funds rate lower since May of 2024.
Since the beginning of the conflict in the Middle East, the Two-year yield has risen above the FED Funds rate and is now almost 40 basis points higher.
This is the case across the entire US Treasury curve and is creating a big problem for an Administration that is accumulating almost $1 trillion in new debt every 100 days.
Both the US Treasury and FED understand that if Treasury yields climb too much higher than the FED Funds rate, debt servicing costs will increase geometrically and may even trigger a systemic liquidity event within the US credit system.
This is what happened back in December of 2019 and forced the FED to cut rates by 75 basis points into what became the COVID-19 crisis.
The volatile trading activity over the last three weeks underscores the fact that that global financial markets are laser focused on news about the Middle East conflict.
The risk is that sometimes news may take a few days to verify.
Against this backdrop of geopolitical and economic tensions and rising government debt, we see demand for safe haven assets like Gold, Silver and Platinum continue to increase.
The current price levels for the precious metals complex are near where they stood at the beginning of the year, while many paper assets are reflecting substantial losses.
This is not surprising since hard assets are the purest forms of money and are the only assets that offer wealth security.
Last week saw the precious metals prices rally sharply from their weekly lows while major stock indexes continued to slide lower into the weekend.
Now is the time to consider taking advantage of the recent pullback in prices and making Gold, Silver and Platinum the cornerstone assets in your long-term wealth creation strategy.
This publication has been prepared for the GBA Group Companies. It is for education purposes only and should not be considered either general of personal advice. It does not consider any particular person’s investment objectives, financial situation, or needs. Accordingly, no recommendation (expressed or implied) or other information contained in this report should be acted upon without the appropriateness of that information having regard to those factors. You should assess whether or not the information contained herein is appropriate to your individual financial circumstances and goals before making an investment decision or seek the help the of a licensed financial adviser. Performance is historical; performance may vary; past performance is not necessarily indicative of future performance. Any prices, quotes or statistics included have been obtained from sources deemed to be reliable, but we do not guarantee their accuracy or completeness.