Gold & Silver Opinion – Stock Markets & Debt Markets
By D Mitchell – Indigo Precious Metals
30th June 2017
Gold & Silver – I have been asked for my opinion on the lengthy consolidation of these metals at these very low prices and what is my view, my honest appraisal …
Has this present undervaluation from the bear market starting in 2011 overextended itself – well yes and no, technically it has achieved well-recognised retracement targets, but timing wise has it gone on far longer than I ever anticipated? Yes far longer than I envisioned.
Although saying that I actually signalled that December 2015 was going to be the low, and in fact so far that has proven to be the case with Silver up +22% (US$) from that low and Gold +19% in US$, in currencies such as GBP £ the moves have been more spectacular Silver + 41% , Gold + 36% as of today.
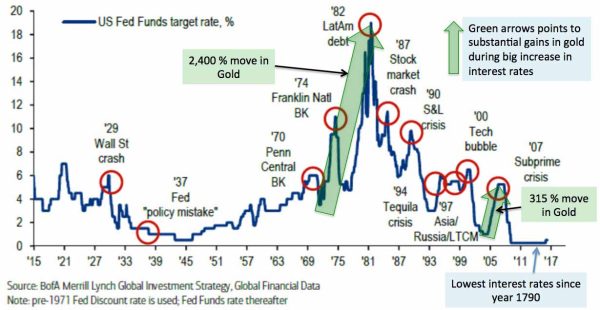
Or we can look at the performance of Gold against other asset classes since the rate hikes started in the USA. Gold the winner !
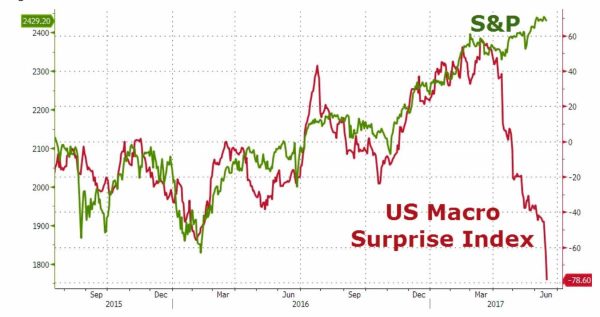
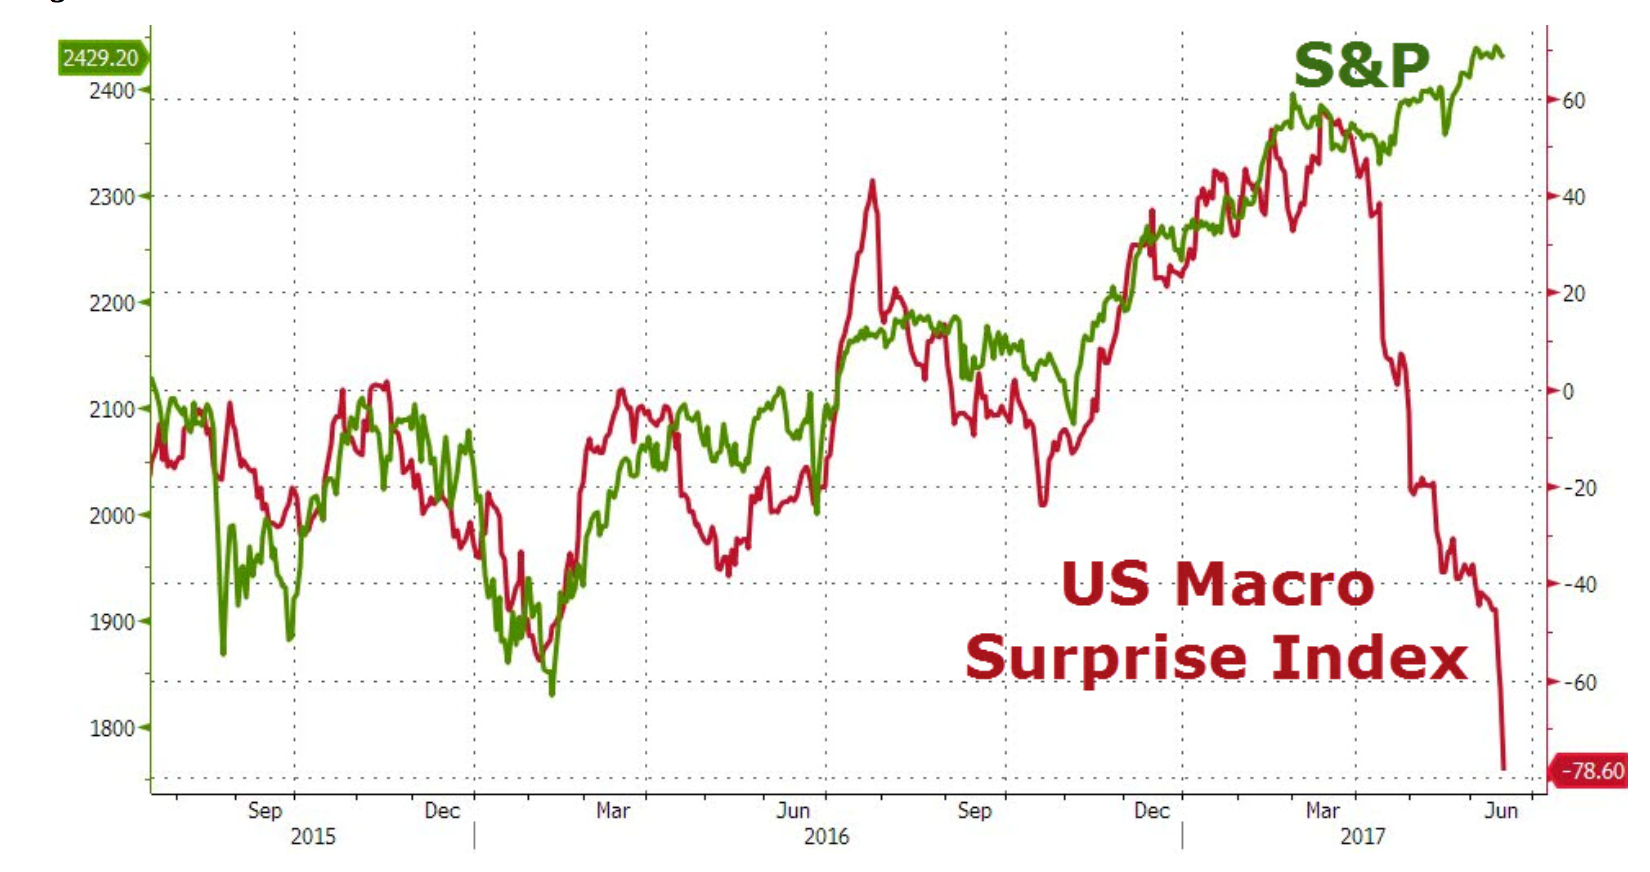
- Stock market overvaluation? – Now world stock markets are priced for absolute perfection. To put this into its proper perspective let us look at the top 500 companies in the USA (S&P 500), to determine the fair value of the S&P 500, we look at the Shiller PE Ratio. Basically, the Shiller PE Ratio (PE = Price to earnings ratio) is defined as the price (Index price) divided by the average ten years of earnings…. adjusted for inflation.
This historical Shiller PE Ratio mean is 16.8. That means S&P 500 price is 16.8 times the average ten years worth of earnings. So, if the Shiller PE Ratio has averaged around 16.8 in its history, what is the ratio today?
The present Shiller PE Ratio is 30.2, or nearly 80% higher than the mean average. Not only is the current Shiller PE Ratio in bubble territory, it is even higher than the 27.4 ratio the last time it peaked in 2007. Well, we all know what happened in 2008 and 2009. During the first quarter of 2009, the Schiller PE Ratio fell to a low of 13.1.
Furthermore, before the stock market crash of 1929 and the ensuing Great Depression, the Shiller PE Ratio reached a high of 32.4 in September 1929….. only a few points higher than it is today.
Side Note: I do expect the stock markets to trade higher later in the cycle, once the world’s debt crisis explodes, as world capital flows will be escaping the much larger world debt markets (debt markets are larger by over 2 times than world stock markets) and have to go somewhere.
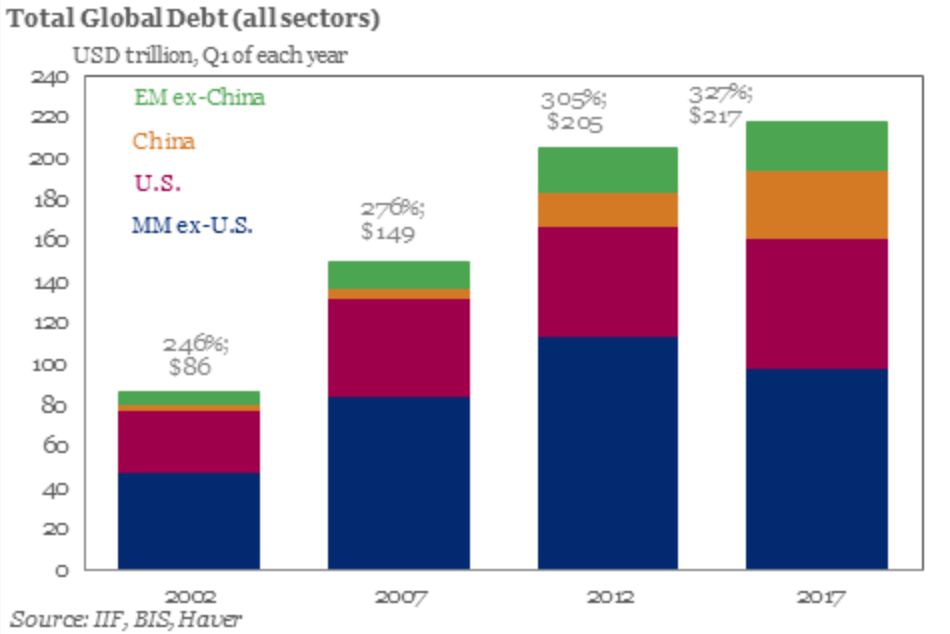
- Debt markets are in the largest bubble ever recorded in history; I don’t believe I need to go into to much detail here about these markets.
The IIF, one of the most authoritative trackers of capital flows, said in a note late on Tuesday that global debt amounted to 327% of the world’s annual economic output (GDP) by the first quarter of 2017…”
Institute of International Finance reports summarizing global leverage statistics, and its latest Q1 report was the most troubling yet, because what it found was that in a period of so-called “coordinated growth”, global debt hit a new all-time high of $217 trillion, or over 327% of global GDP, up $70 trillion since the 2007 debt, solvency crisis!
The lowest interest rates in USA’s 227 year history. Or the UK the lowest interest rates in over 500 years of recorded data. Where do you think the next crisis is coming from, higher interest rates on the back of the largest world debt bubble ever recorded in history by far?
We have seen net buying of gold by central banks for their official reserves started in late 2009 and growing every year since then. This net buying is unprecedented in modern times and not seen since the 1960’s.
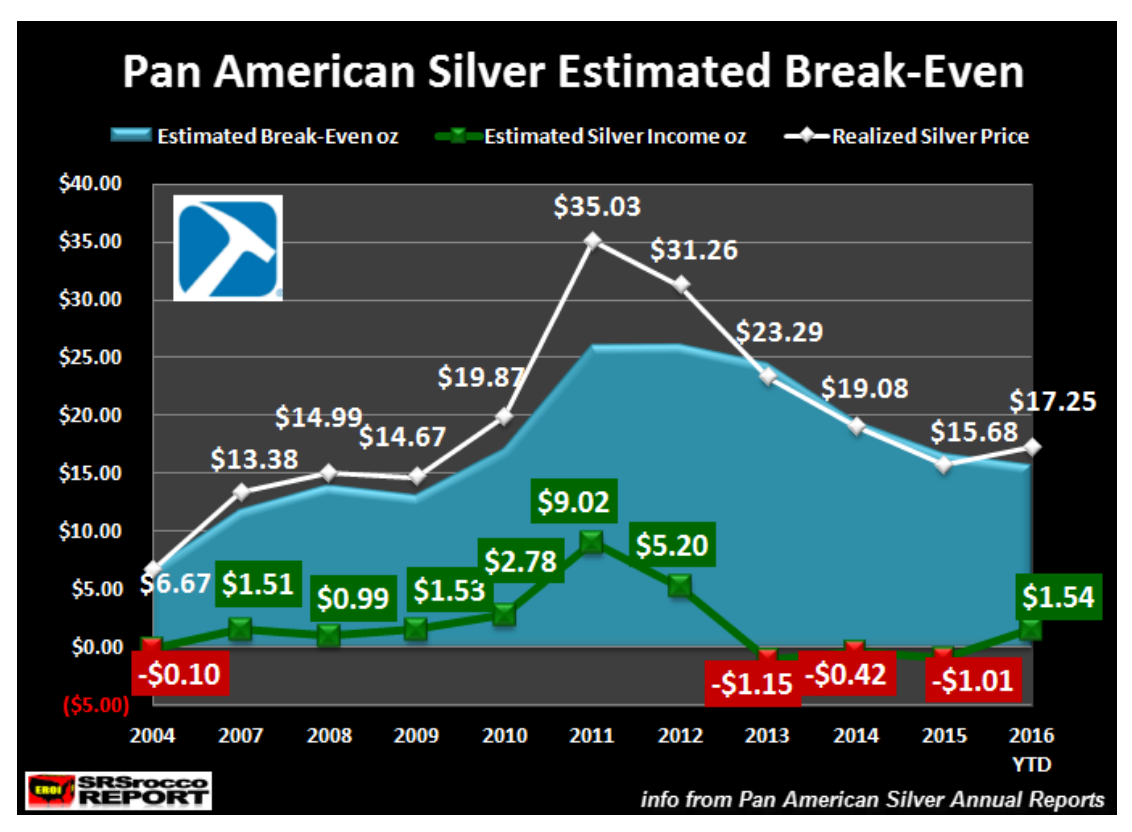
Silver global production costs (all in costs) are recorded at between 16 to 17 US$ an ounce as of Year 2017 for primary silver miners (+30% of global production of silver).
Gold is officially recognised at between US$ 1,100 to US$ 1,500 (depending on what country and mining operation).
We are also running at extreme yearly physical supply/demand deficits in both metals, and with falling mine production (again of both metals) started in 2016 and forecast to drop for the next 5 years at least annually!
Markets historically can trade at extreme undervaluation’s and overvaluations for long periods of time before they turn violently, stock markets are extremely overvalued at this point in history using any metric you care to look at, debt markets are nothing short of delusional with the impossibility of these debt securities ever being paid back and saying they are the most overvalued in all of history, meanwhile metals are the most undervalued going back with 30 to 40 years of inflation-adjusted data, we have never seen such an undervaluation before in metals, and with such powerful buyers in the background secretly accumulating.
Well, this trade is the most obvious trade in over 30 years of my trading investment career.
I know where I want my money at this particular point in history!
About the Writer
 David Mitchell, is a friend and respected colleague of the GBA team. David has nearly three decades of experience and expertise in the financial markets working for some of the world’s leading international banks; he brings his knowledge and energy to the role of Managing Director at IPM Group.
Click on the image to download the Gold & Silver Opinion by David