Platinum price to rise as “climate change” pressure gains traction
Platinum Market Review – Part 1 of a 2-part presentation
Platinum price to rise as “climate change” pressure gains traction
February 2020
Dr David Davis PhD. MSc. MBL. CEng. CChem. FIMMM. FSAIMM. FRIC.
Precious Metals Consultant
In this review, I argue that the demand for platinum will accelerate “significantly” within the next five years as global environmental “climate change” pressures gain traction combined with ever tightening vehicle tailpipe emission standards. In this regard, it is likely that the market balance surrounding platinum supply-and-demand fundamentals will likely move into deficit. It is important to note that the “continuity” of the global supply of platinum is not without risk, as supply depends heavily on the South African PGM industry, which supplies some 73%, 37% and 82% of global platinum, palladium and rhodium respectively (Johnson Matthey (JM). Under these circumstances, I am of the view that an environment of ever-increasing demand coupled with downside supply risk going forward will inevitably result in upward pressure on the price of platinum.
Setting the scene
It is important to set the scene surrounding the use of and demand for platinum (palladium, rhodium) as a catalyst for the reduction in harmful vehicle tailpipe emissions. This summary, in my view, puts into perspective and connects the historical evolution surrounding the demand for platinum group metals (PGMs) and the global environmental demands and gives an insight into the way forward.
In response to the introduction of vehicle regulation and standards for controlling the tailpipe emission of harmful gases (US Clean Air Act of 1970), vehicle manufacturers introduced catalytic conversion technology to meet these standards by using platinum, palladium and rhodium ( PGMs) in various ratios to catalyse (neutralise) harmful gases such as carbon monoxide and the oxides of nitrogen.
Vehicle emission standards have been progressively tightened through regulation worldwide since 1970. In response, vehicle manufacturers have had to increase the content (loading and loading ratios) of palladium, platinum and rhodium (PGMs) in autocatalysts to meet the stricter limits. JM expected to see a step change increase in autocatalyst loadings with the adoption of the China 6 emission standards in 2019. The market also expects autocatalyst loadings to increase in other regions to comply with more stringent vehicle emission and testing standards. The tighter heavy-duty emission regulations and testing standards are being progressively introduced (2019 and 2024). These standards will apply in major vehicle markets.
It is important to note that a palladium and rhodium metal mix is used in petrol catalytic converters, whereas a platinum, palladium and rhodium metal mix is used in diesel catalytic converters. Of note, is that the first gasoline catalytic converters initially used platinum as the primary metal in the mix and over time platinum was substituted with palladium. Platinum is the predominant PGM in the metal mix in diesel autocatalysis. It should also be noted that diesel engines are “lean-burn”, meaning they use less fuel and more air to achieve the same performance as petrol engines. Furthermore, they emit around
c. 20% less greenhouse gas emissions, especially carbon dioxide (CO₂).
As part of the EU’s response to the 1997 Kyoto Protocol to reduce greenhouse gas emissions, especially CO₂, the EU published legislation in 2009 stating that it will impose substantial penalties on EU vehicle manufacturers that do not comply with the Euro 6 emission standards, beginning January 2021. For each passenger vehicle sold, EU vehicle manufacturers will be charged €95 for every gram of CO₂ over 95g that they emit per km.
The World Platinum Investment Council (WPIC) recently published an example of how huge this penalty can be: If an automaker that sold 1.8m cars in 2018, with average fleet CO₂ emissions of 113g/km, sold 1.8m cars in 2021 and managed to reduce its fleet CO₂ emissions to101g/km, a tough ask, its annual fine would be just over €1 billion. (i.e.101g/km–95g/km = 6mg/km x €95 x 1.8m cars).
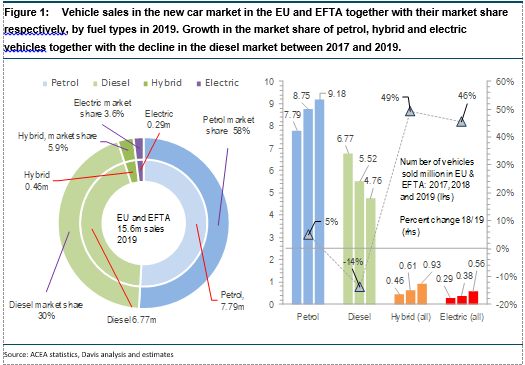
The Volkswagen emissions scandal, also known as Dieselgate, began in September 2015, when the United States Environmental Protection Agency (EPA) issued a notice of violation of the Clean Air Act to German automaker Volkswagen Group. Dieselgate precipitated a backlash against diesel, also known as “de-dieselisation”, and as a result the sales of diesel, particularly in the EU, declined considerably. Since 2016, the diesel car market share in Western Europe has fallen from c.50% to c. 30%. (AECA). Figure 1 illustrates vehicle sales in the new car market in the EU and EFTA together with their market share respectively, by fuel types in 2019. Figure 1 also illustrates the growth in the market share of gasoline, hybrid and electric vehicles together with the decline in the diesel market between 2017 and 2019.
The market indicates that the downturn in diesel sales was initially replaced by petrol rather than battery or hybrid vehicles. It is of significance to note that the loss in diesel market share between 2017 and 2019 represents a decline of around c. 2.1 million vehicles, which has had a negative impact on platinum demand. Conversely, the growth in gasoline vehicles over the same period was around c.1.4 million vehicles.
It is important to note that the percent change increase between 2018 and 2019 was huge for hybrid and electric vehicles respectively. (Figure 1).
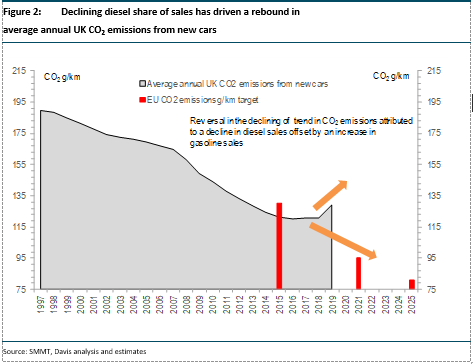
The migration to petrol vehicles has had an impact on the historical declining trend in tailpipe CO₂ emissions to the extent that a reversal has been observed since 2017. This reversal, in the average UK CO₂ emissions from new cars is illustrated in Figure 2 below. Figure 2 implies that if this trend is not reversed, UK vehicle manufacturers (similarly to EU vehicle manufacturers) will likely be hit with heavy fines for non-compliance with EU CO₂ emission standards.
In an attempt to mitigate the potential of huge fines for non-compliance with CO₂ standards, the vehicle industry has strategically shifted significantly to the introduction of electrification, whether it be battery electric vehicles (BEVs), plug-in hybrid electric vehicles (PHEVs), fuel cell electric vehicles (FCEV), 48v mild hybrids or full hybrid electric vehicles, 48v mild hybrids or full hybrid electric vehicles (HEVs).
GlobalData reports that “without the extensive introduction of electrification, the industry could be hit with ruinous fines totaling over €24.5bn”.
In this regard, the industry noted an uptick in diesel market share in Germany, Spain and France in the second half of 2019 into 2020, which has been attributed to this new offering of mild hybrid diesel vehicles. Furthermore, the tailpipe emissions of mild hybrid diesel vehicles have low CO₂ and very low NOx levels. It is important to reiterate that platinum is the predominant PGM in the metal mix in diesel autocatalysts. Mild hybrid diesel vehicles contain more platinum per vehicle than smaller diesel sedans and could therefore materially lift platinum demand (WPIC). JM/WPIC reports that every 4% increase in European diesel market share adds c.100koz of platinum automotive demand. This demand becomes increasingly significant when CO₂ compliance-related growth is considered. In my view, it is likely that this figure may well increase to at least c.200koz.
In this conversation, I have summarised the use of PGMs, with particular reference to platinum as a catalyst for the reduction of harmful auto vehicle tailpipe emissions. It is evident that global environmental “climate change” pressures combined with ever tightening vehicle tailpipe emission standards is intensifying the demand for PGMs, which ultimately, puts upward pressure on their price.
This has been reflected by market balance deficits and catapulting prices, particularly with regard to palladium and rhodium. The price of platinum, however, has not yet advanced at a similar pace.
It is evident that diesel and hence platinum demand has come full circle. In this regard, I am of the view that the demand for platinum is positive given the overwhelming global “climate change” pressure on vehicle manufacturers.
In this conversation, I have alluded to the vehicle industry’s significant shift to the introduction of electrification. Among the various configurations of vehicle electrification listed, is the fuel cell electric vehicle (FCEV). Platinum is the driving agent in fuel cells. Simply, a fuel cell uses hydrogen gas (H2) and oxygen gas (O2) as fuel, which is catalysed by platinum to produce electricity and water (H2O). The products of the reaction within in the cell are water, electricity and heat.
Fuel cell technology has advanced significantly over the past two decades. The global focus on “climate change” to ultimately phase out fossil fuels and to turn to clean green energy, electricity, has now been firmly embedded in the auto manufacturing industry, As a result, the demand for platinum will increase significantly going forward.
Fuel cell vehicles
Fuel cell vehicles are already on the market.
The advancement of fuel cell technology was given a significant boost with the launch of “The Hydrogen Council” during the World Economic Forum in Davos in 2017.This is a global initiative of leading energy, transport and industry companies with a united vision and long-term ambition for hydrogen to foster the energy transition.
It is important to note that fuel cells have many applications apart from vehicles, which include heavy vehicles, buses, forklifts, boats, trains, submarines, aerospace, space and numerous stationary applications, which include powering homes and industry.
Many governments, including Japan, South Korea and China, have put the development of fuel cell technology high on their agendas and are investing heavily in technology development and infrastructure for hydrogen and fuel cells. The development of infrastructure to support refuelling vehicles and industry is also expanding at a pace. In this regard, it is important to note that refuelling a hydrogen vehicle is as easy and quick as filling a petrol or diesel vehicle. In contrast, charging times for battery vehicles, especially heavy-duty vehicles, are much longer. Furthermore, questions are being asked surrounding the competency of electrical grids to handle an increasing number or battery electric vehicles.
It is important to note, and according to industry reports, that around 99% of hydrogen is currently produced from hydrocarbons, namely natural gas and coal. As a result, its production is an abundant source of CO₂ emissions. In this regard, hydrogen produced in this manner does not conform to global “climate change” principles, which are to ultimately phase out fossil fuels and to turn to clean green energy. Hydrogen can, however, be produced from renewable energy sources. Hydrogen produced in this manner is known as green hydrogen as its production eliminates the emission of CO₂. Green hydrogen is produced in many ways, which mainly involves electrolysis, wind farms and hydro power, to name a few. Many Western governments are calling for large-scale green hydrogen production within 10 years.
The detractors of the implementation of fuel cell technology have used concerns surrounding hydrogen by drawing attention to the fact that fuel cell tanks can explode in an accident, fuelling infrastructure is lacking and that the technology is unproven. Furthermore, the technology is expensive when compared to BE and petrol vehicles. In my view, vehicle manufacturers have no alternative other than to “accelerate” the introduction of FCEVs in accordance with greenhouse gas emission standards. The pressure to implement this change is overwhelming and could be compared to a tsunami.
Much has been said with regard to the relatively large quantum of platinum required for a diesel passenger vehicle powered by a fuel cell when compared to the smaller quantum required in a catalytic converter in a diesel passenger vehicle. Prior to technological advances around 30g to 60g of platinum was needed for a fuel cell, a diesel passenger vehicle typically uses 3g to 7g.
Optimisation efforts concerning platinum in fuel cells at Bosch have indicated that there is now about the same amount of platinum content required for a fuel cell to that of a diesel catalytic system. Commercial fuel cell units are expected to launch this year. A further example of technological improvements was recently reported by Reuters: “the best-selling fuel cell vehicle, Toyota’s Mirai, is expected to cut platinum content by two-thirds to around 10g per vehicle in its next version, down from 30g in the current model”. It should be noted that the large global automakers have or are about to launch high-tech FCEVs. Noting, as previously indicated, FCEV tail-pipe emissions are totally devoid of any harmful emissions as they only emit water.
The significance of the reduction in the platinum content in fuel cells cannot be overestimated as this step change opens the door for platinum demand to accelerate.
The market and price
There have been important changes in catalytic converter technology since its inception, as indicated above. In this regard, the PGM mix within the converter has changed significantly, for example, in petrol converters platinum has been substituted by palladium over time. In diesel converters platinum has been, in part, substituted by palladium. It should be noted that the price differential between the higher price of platinum against the significantly lower price of palladium played a part in motivating this change. The net result of the redistribution had the effect of reducing the net demand for platinum, which was partially offset by an increase in demand for platinum from the growth in diesel engine market share, including heavy-duty diesel vehicles. As a result, platinum prices have been in general decline since 2011, whereas palladium prices have exhibited a continuous upward trend since 2011. This trend accelerated significantly 2017, barrelling the palladium price through USD2,000/oz in early January 2020 on the back of increased demand and tightness in supply.
Figure 3 illustrates the daily price fluctuation of platinum and palladium from 2008. Figure 3 also illustrates the comparative nature of the market in its response to platinum and palladium, particularly between 2008 and 2011. For example, according to JM, the platinum price was subject to extraordinary volatility during 2008: The price started January at USD1,530/oz and ended the year at USD899/oz. Nevertheless, the price climbed to an all-time record high of USD2,276/oz in March, demonstrating the enormous volatility almost throughout the entire year. The high price of platinum in the first half of the year was attributed to an increase in autocatalyst demand and supply problems, which were caused by significant periods of electricity outages in South Africa. The platinum price went into free fall in the second half of the year caused by the global economic crises which resulted in a significant decline in vehicle demand and hence the demand for platinum fell away.
As noted above, Dieselgate precipitated a backlash against diesel and as a result the sales of diesel, particularly in the EU, declined considerably in 2016. The loss of diesel market share between 2017 and 2019 represents a decline of around c. 2.1 million vehicles, which has had an impact on platinum demand and, in turn, suppressed any price break-out. In this regard, the daily average platinum price has, to all intents and purposes, gone sideways, exhibiting little volatility, averaging USD898/oz between 2017 and 2019.
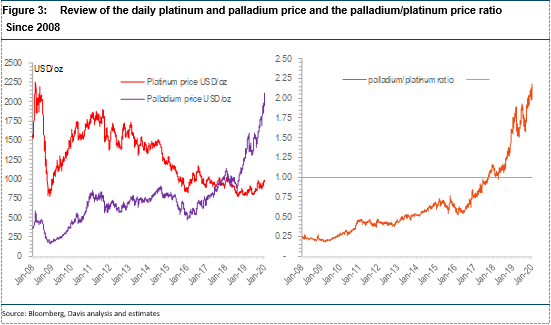
It is interesting to note that the daily palladium/platinum price ratio reached “one” in October 2017: since then the ratio has increased significantly, implying a palladium price premium over platinum of around c. USD1,360/oz 10 February 2020) (Figure 3). Under these circumstances, vehicle manufacturers are intensifying research on the potential for substitution of palladium for platinum in petrol applications. There are, however, many technical hurdles to overcome. There are a few reports stating that these hurdles have been overcome and if proved correct, substitution may well happen in as little as two years. This development will be positive for platinum demand.
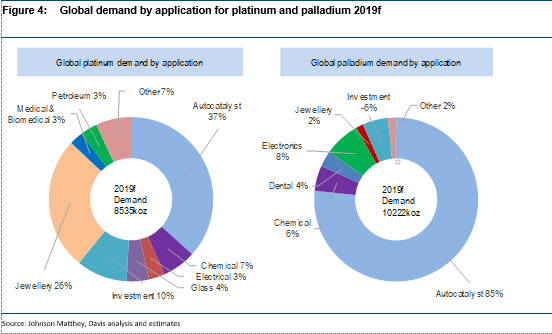
It is important to recognise that there is a significant difference between the sectors and the quantum of demand associated with the application of platinum and palladium. Figure 4 below illustrates these differences by application and demand. For platinum, autocatalysts, jewellery and investment at c.37%, 26%, and 10% respectively, are the main drivers of demand. Whereas, for palladium, autocatalysts, electronics and investment at 85%, 8% and -6%% respectively, are the main drivers of demand. It is clear that platinum demand is also influenced by jewellery demand and is therefore subject to the vagaries of choice and societal economic factors. Investment in both platinum and palladium is, however, a significant swing factor in demand, particularly for platinum.
Investment
Continued investment demand for platinum bullion or other investment platforms, such as exchange traded funds (ETFs) are a strong indicator that some investors believe that platinum is underpriced and has a positive fundamental outlook. Investor demand for platinum ETFs was renewed substantially, by around c.900koz in 2019, recording a year-end holding of around c.3.3moz, Figure 5.
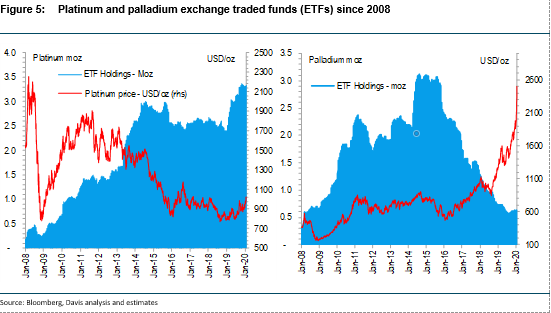
Figure 5 illustrates ETF holdings of platinum and palladium since 2008. It is interesting to note the comparison between the general movement in platinum and palladium ETF holdings are different over time and are at different ends of the scale, or investor sentiment. In the case of investor sentiment surrounding platinum, investors are buying into low prices on expectations of a positive change in demand fundamentals. Whereas, in the case of palladium, investors have taken profits as the price of palladium sky-rocketed.
Part 2 of this presentation will be posted in next weeks newsletter
About Dr David Davis PhD. MSc. MBL. CEng. CChem. FIMMM. FSAIMM. FRIC.
David has been associated with the South African mining industry and mining investment industry for the past 43 years (mainly PGM, gold and uranium). At present, David is working as an independent precious metal consultant. David’s PhD involved: “Studies in the catalytic reduction and decomposition of nitric oxide 1976”.
Important Notice
General Disclosures, Disclaimers and Warnings
This Report (“the report”) in respect of the global Rhodium Industry is directed at and is being issued on a strictly private and confidential basis to, and only to, Professional Clients and Eligible Counterparties (“Relevant Persons”) as defined under the Investment Research Regulatory Rules and is not directed at Retail Clients. This report must not be acted on or relied on by persons who are not Relevant Persons. Any investment or investment activity to which this Report relates is available only to Relevant Persons and will be engaged in only with Relevant Persons.
The Report does not constitute or form part of any invitation or offer for sale or subscription or any solicitation for any offer to buy or subscribe for any securities in any Company discussed nor shall it or any part of it form the basis of or be relied upon in connection with any contract or commitment whatsoever.
The opinions, estimates (and where included) projections, forecasts and expectations in this report are entirely those of Dr David Davis as at the time of the publication of this report, and are given as part of his normal research activity, and should not be relied upon as having been authorised or approved by any other person, and are subject to change without notice. There can be no assurance that future results or events will be consistent with such opinions, estimates (where included) projections, forecasts and expectations. No reliance may be placed for any purpose whatsoever on the information or opinions contained in this Report or on its completeness and no liability whatsoever is accepted for any loss howsoever arising from any use of this Report or its contents or otherwise in connection therewith. Accordingly, neither Dr David Davis nor any person connected to him, nor any of his respective Consultants make any representations or warranty in respect of the contents of the Report. Prospective investors are encouraged to obtain separate and independent verification of information and opinions contained in the Report as part of their own due diligence. The value of securities and the income from them may fluctuate. It should be remembered that past performance is not necessarily a guide to future performance.
Dr David Davis has produced this report independently of the companies that may be named in this report except for verification of factual elements. Any opinions, forecasts, projections, or estimates or other forward-looking information or any expectations in this Report constitute the independent judgement or view of Dr David Davis who has produced this report (independent of any company discussed or mentioned in the Report or any member of its group).
The Report is being supplied to you for your own information and may not be reproduced, further distributed to any other person or published, in whole or in part, for any purpose whatsoever, including (but not limited to) the press and the media. The distribution of the Report in certain jurisdictions may be restricted by law and therefore any person into whose possession it comes should inform themselves about and observe any such restriction.
The Report has been prepared with all reasonable care and is not knowingly misleading in whole or in part. The information herein is obtained from sources that Dr David Davis considers to be reliable but its accuracy and completeness cannot be guaranteed.
Dr David Davis Certification
Dr David Davis attests that the views expressed in this report accurately reflect his personal views about the global Platinum Industry. Dr David Davis does not hold any interest or trading positions in any of the Companies mentioned in the report.