Historical Investment Opportunity Presents Itself
By David Mitchell – 16 March 2018
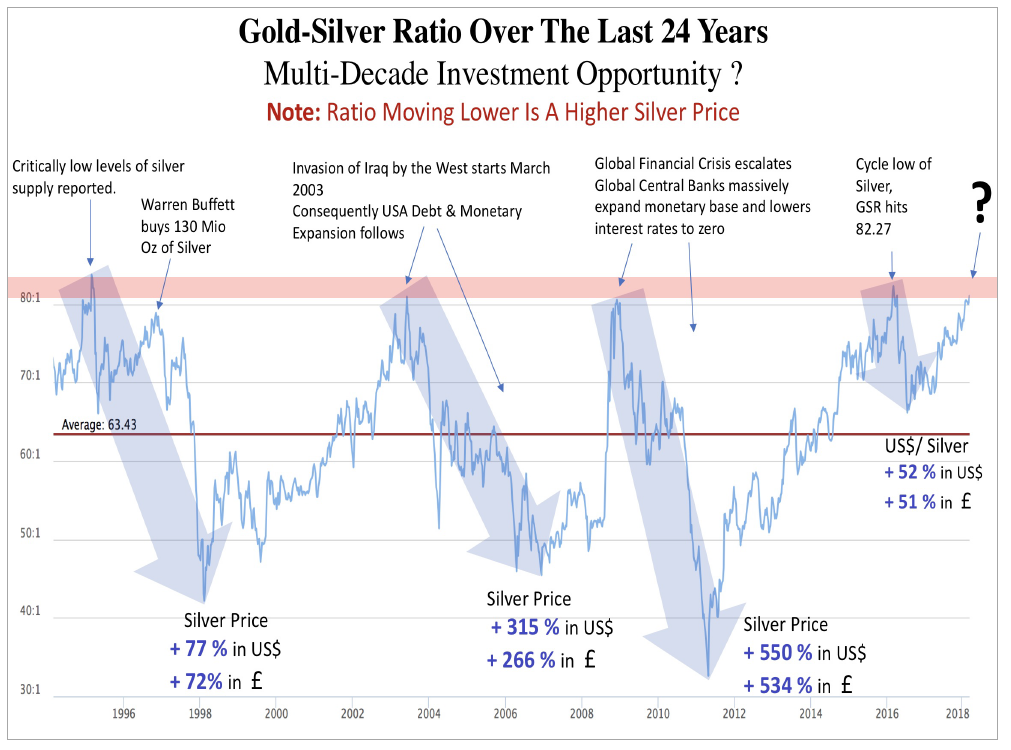
Asset markets move in cycles, from extreme euphoric overvaluations into severe misunderstood undervaluation’s, and hence incredible investment opportunities arise which simply cannot be ignored. We are again faced with such an event and a multi-decade historical buying opportunity in silver.
Market dynamics for silver are building dramatically with price distortions becoming very obvious indeed, for example, looking at physical global mine production in the year 2016 * the ratio of silver to gold was just above 8 to 1, for every 1 ounce of gold mined and produced there are only 8.5 ounces of silver produced, thus the physical Gold Silver Ratio (GSR) is naturally 8.5 to 1.
As of today, silver is priced with a price ratio of over 81 to 1, a huge disparity indeed and actually a historical marker of investor opportunity. In fact, the average based on the last 226 years has been closer to 48 to 1, with regular visits much lower.
For example:
- February of 1995 the GSR reached levels of over 85 to 1, three years later by February of 1998 silver ratio was back down to 38 to 1 and silver had appreciated in £ terms by + 88 %.
- June of 2003 the GSR reached levels of 82 to 1, by early December of 2006 silver ratio was back down to 45 to 1 and silver had appreciated in £ by + 266 %.
- November of 2008 the GSR reached levels of 84 to 1, by April of 2011 silver ratio was back down to 31 to 1 and silver had appreciated in £ by + 534 %.
- February of 2016 the GSR reached levels of 83 to 1, in just four months into July 2016 the silver ratio was trading at 66 to 1 and silver had appreciated in £ by + 51 %.
But this is not the only buy signal in silver that’s flashing green, we are seeing very large developments over the last couple of years in the mine production of silver, cost of production and increase in industrial usage and demand.
Peak Silver Production? Silver Ore Grades Fall Precipitously
The market is becoming acutely aware of peak silver mine production (global mine supply fell -1% in 2016, and a further contraction in 2017 of -2%), in fact in just two years, the combined silver output from Mexico, Peru, and Chile (world’s 3 largest producers) is down 21 Moz per annum in total production, 373 Million Ounces in 2015 to 352 Million Ounces in 2017, a considerable fall of close to – 6%.
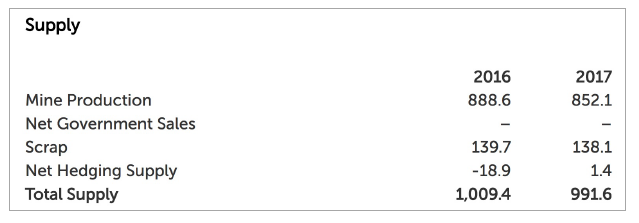
Source: Silver Institute
Scrap supplies, which has been an important contributor to market equilibrium, have also collapsed, to just 138m oz in 2017, down from 181m oz in 2000 and peaked at 261 m oz in 2011. That’s despite the fact silver prices traded at approximately $5 an oz in the year 2000 compared to roughly $17 today. Meanwhile, net Government sales have vanished completely from the market from the year 2014 onwards, dipping from 89m oz in 2003 to just 8m in 2013, which was the last year we saw official sales, and confirming what industry experts have long feared, that official holdings of silver are exhausted.
Ore grades in some of the very largest silver mine production facilities have fallen precipitously, thereby forcing cost of production higher as a far greater amount of rock and soil needs to be processed to achieve the same amount of silver.
Cannington Mine in Australia have seen a ore grade degradation of 20.45 oz per tonne in year 2000 and by 2016 only 8.20 oz per tonne, a – 60% fall in ore grades, while the Fresnillo Mine in Mexico has ore grade degradation of 15.2 oz per tonne in 2005 to 6.5 oz by year 2015, a – 58% fall in ore grades.
While Industrial Demand Grows
Last year, silver industrial fabrication demand is reported to have grown by + 4 % to 599.Moz 2, achieving the highest industrial demand so far this decade, with further gains expected moving forward.
What stands out in the latest updated yearly report by the silver institute is that even with a dramatic fall in investment demand in 2017, the net balance yet again reported a deficit in silver of over -35 Moz
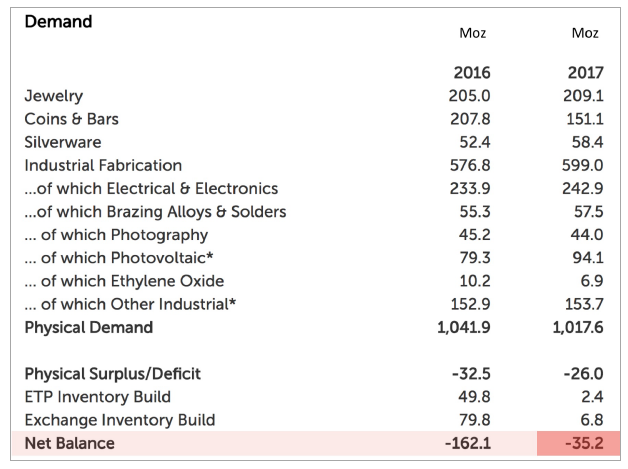
Source: Silver Institute
Growth was widespread across key industrial applications in 2017, a trend which is projected to continue this year by Metals Focus. Looking at photovoltaics (PV), the global market achieved further robust growth in 2017, with a newly installed capacity of around 100GW. This represented a 27% y/y rise, bringing cumulative installations to over 400GW by end of 2017. Obviously, such a strong increase of demand in PV applications translated directly into higher silver consumption.
Silver Industrial Demand Moz, with 2018 Forecast
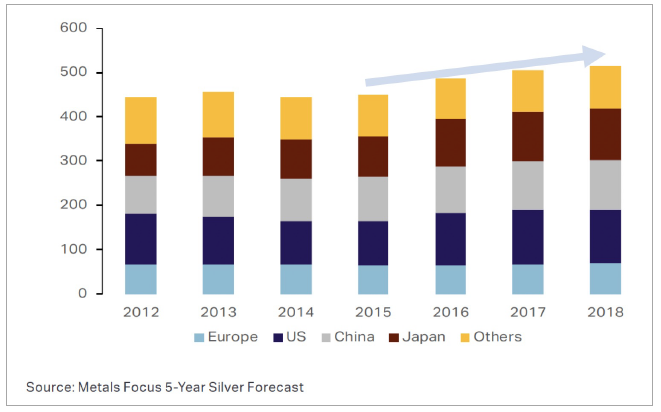
The surge in electronics, most notably in semiconductor fabrication demand, led to the electrical and electronics segments delivering the first annual increase in offtake in this category since 2010, with 242.9 Moz consumed last year.
So, to summarise a confluence of dynamics are coming together to produce a very exciting investment prospect, historical gold / silver ratio sell signal triggered indicating higher silver prices, falling mine supply, rising silver mine production cost price, extremely low scrap silver supply and zero net government silver sales, and finally higher industrial application demand across all sectors, a very rare set of circumstances indeed.
- 1 Source: USGS, WGC, GFMS & Thompson Reuters (Information: 32,150.75 troy ounces in 1 metric ton) Global Silver & Gold Mining Production Ratios For 2016 Silver: 27,551 metric tons (8.5 times gold), Gold: 3,236 metric tons.
- 2 Source: World Silver Survey 2018, GFMS & Thompson Reuters on behalf of Silver Institute
https://www.silverinstitute.org/silver-industrial-demand-rebounded-2017-mine-supply-recorded-second-consecutive-loss