Silver Cracks $59.00 in Front of This Week’s FOMC Meeting
Since the US central bank cut the FED FUNDS rate in late October, speculation about their next policy move has been a primary driver of global financial markets.
The precious metals complex traded lower during early November as the forward market odds of a December rate cut slipped below 30%.
However, as the probability of further easing increased over the last three weeks, the USD has dropped against the G-10 currencies, which has lifted Gold, Silver, and Platinum prices higher.
Physical Gold priced in USD reached a two-month high of $4265.00 before drifting lower into the weekend to close fractionally lower at $4197.00.
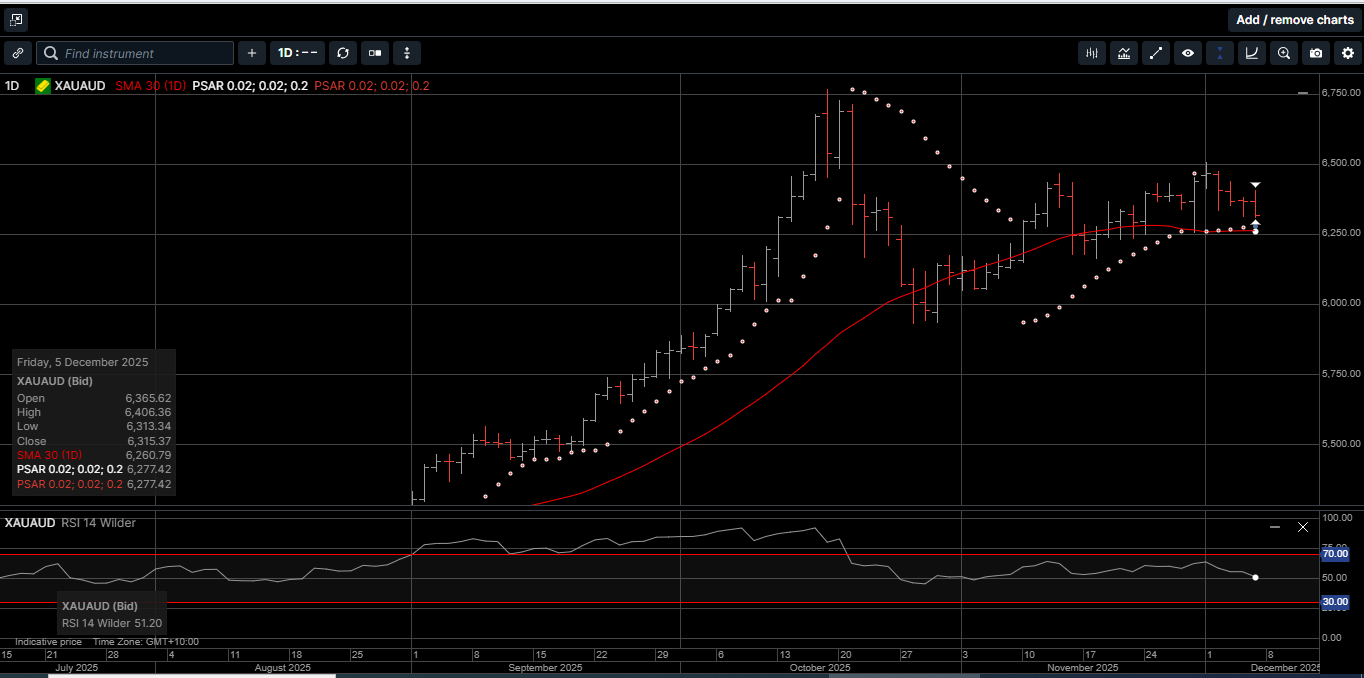
Gold denominated in AUD posted a two-month high of $6505.00 but slid lower to close down 1.9% at $6315.00. The 1.3% rally in the AUD/USD put downside pressure on AUD Gold.
Physical Silver priced in USD hit a new all-time high of $59.35 in early London trade last Friday but reverted lower during the NY session to close 3.4% higher at $58.30.
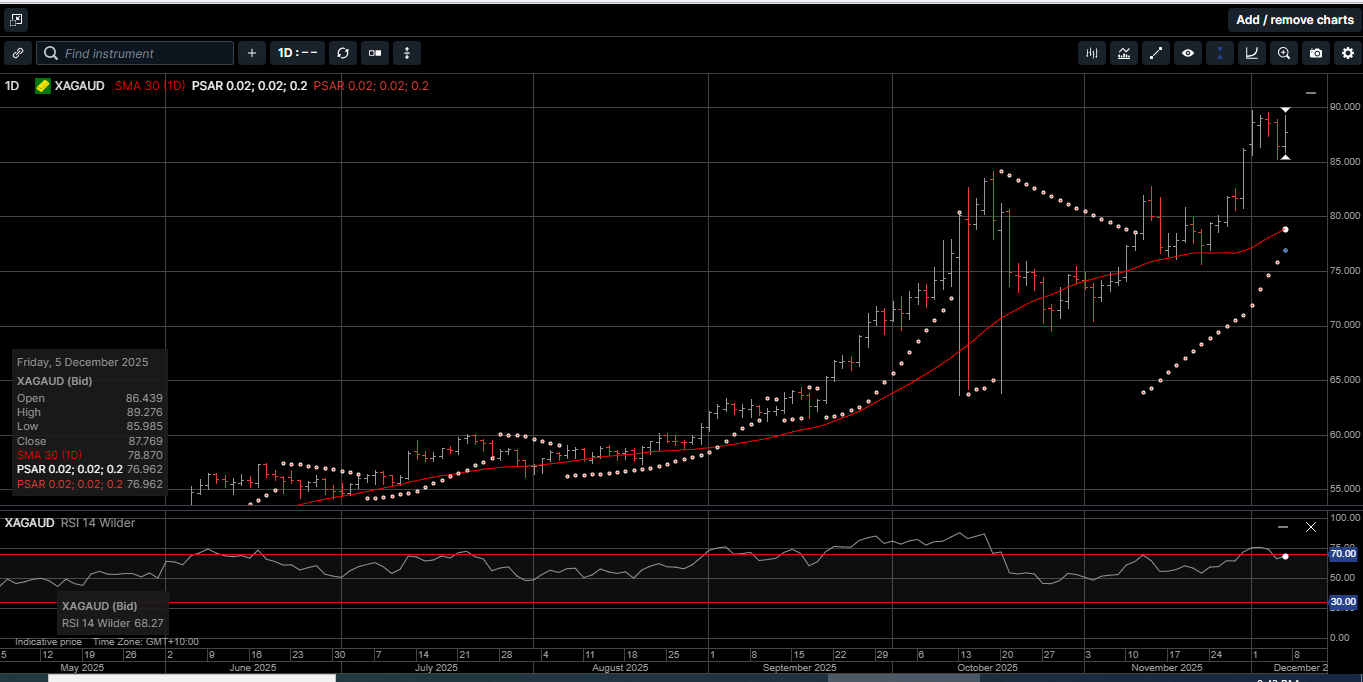
Silver denominated in AUD came within a whisker of breaking the $90.00 level and set a new all-time high at $89.75 last Monday. For the week, AUD Silver rose 2.1% and closed at $87.80.
The technical picture for Silver in both currencies looks constructive, not overbought, and they are poised for further near-term gains.
The Gold versus Silver ratio moved 4.1% lower in favor of Silver and posted a 16-month low at 71.48. That means it takes 71.48 ounces of Silver to equal the price of one ounce of Gold.
Since reaching a high of 107.10 in late April, the Gold versus Silver ratio has moved by over 33% in favor of Silver.
As such, the theme of Silver outperforming Gold over the medium-term now seems ossified within the broad market narrative.
Physical Platinum tagged a three-month high of $1725.00 last Monday but then consolidated lower to close out the week with a 2.1% gain at $1670.00.
The internal momentum indicators are pointing higher, which suggests a move back into the $1800.00 handle early in the new year.
And while the calendar year 2025 is drawing to a close, the US government’s 2026 fiscal year has just started.
Last Tuesday, the US Treasury published the October budget report, and it was not pretty.
Tax receipts were not too bad: at $404 billion, consisting of $217 billion in income taxes and $128 billion in social security receipts.
The government revenues were actually a solid 23.7% improvement to the $326 billion collected in October 2024.
Of course, that includes the now solid monthly contribution from the Trump administration’s tariffs which in October added $31 billion to the tally.
As usual, it was government’s excessive spending that was the problem.
The spending pace for October was $689 billion, which pencils out to over $22 billion per day. The October total was a 17% jump compared to the $584 billion spent a year prior.
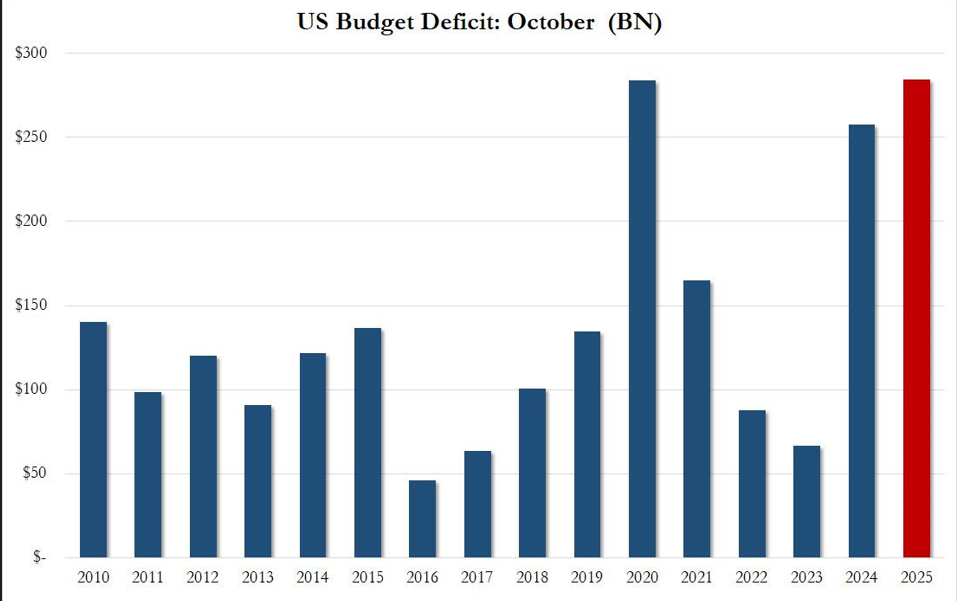
As illustrated on Chart 1, the combination of these two numbers resulted in a $285 billion deficit for the month of October.
That number was not only higher than the $257.5 billion deficit last October, but also higher than the record monthly deficit set during the COVID-19 panic of $284.1 billion in October 2020.
And since the US are now only one month into fiscal 2026, America now has the worst budget-deficit start to a fiscal year in US history.
Taking a closer look at the causes of the October budget-busting deficit reveals the same usual suspects: spending across all major categories increased in October.
But the most dramatic expense was once again the relentless surge in the gross US interest, which is now a record $1.24 trillion over the last twelve months.
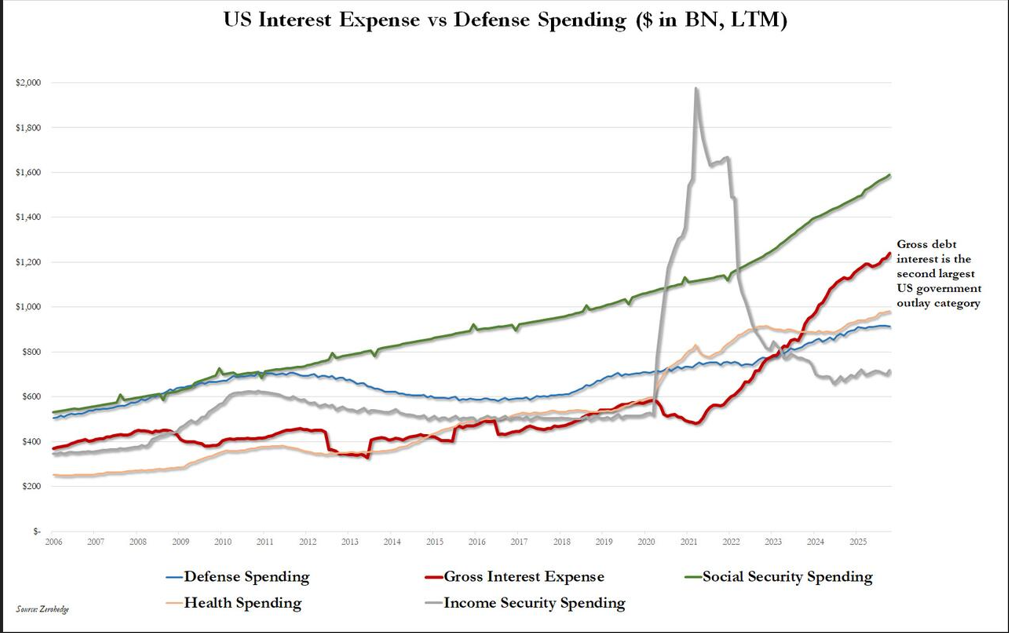
Further, as shown on Chart 2, interest payments are rapidly approaching social security ($1.589 trillion) as the largest source of government spending.
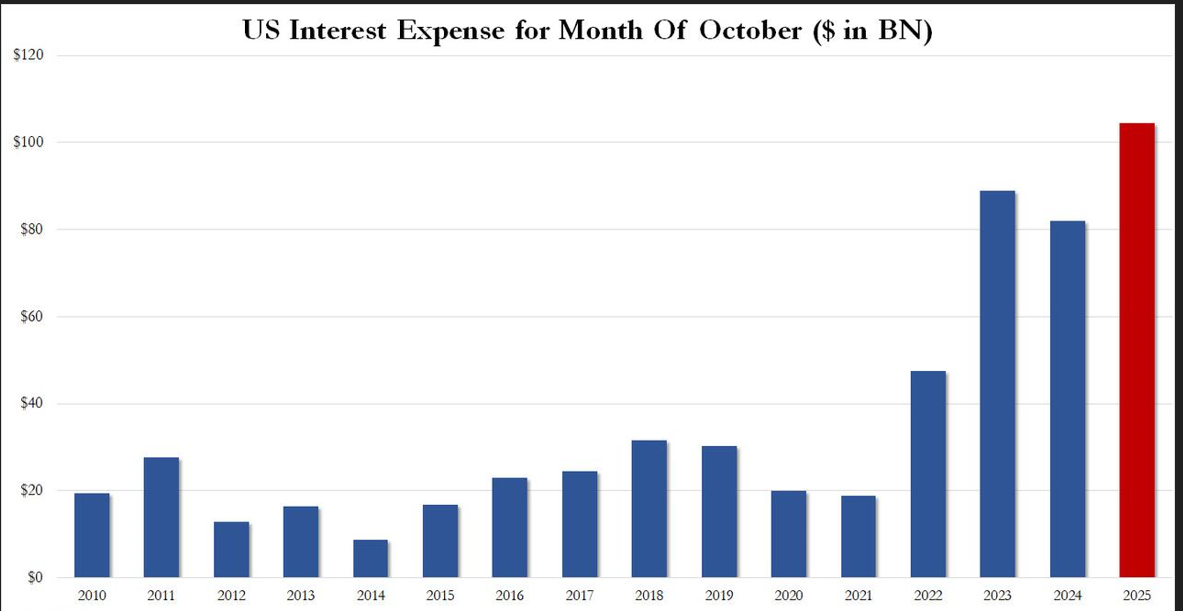
And to make matters worse, as shown on Chart 3, October gross interest was a record of $104 billion, the highest for the month in the history of the US.
And at $1.24 trillion in the last 12 months of interest expense, it means that a staggering 24 cents of every dollar in collected taxes goes to pay interest on the US debt.
Bottom line is that after a brief period of hope in early 2025 that the US would be able to cut excessive spending and work their way to reversing the ballooning interest payments, the US fiscal outlook is not only one of failure, but it has never been worse.
It is this fiscal nightmare that keeps many market commentators convinced that the US FED will continue to ease rates; and keeps central banks, financial institutions and provident investors interested in holding hard assets.
Based on the closing prices from last Friday, the precious metals have had the following year-to-date results: Gold in USD and AUD have gained 59% and 51%, respectively. Platinum has rallied 75% so far this year, USD Silver has returned an eye-watering 97% and AUD Silver has risen by a very respectable 84.5%.
It seems like a simple equation: if the US fiscal situation continues to get worse, and the FOMC has to ease financial conditions to keep the US government solvent, then investors will continue to seek the safe haven of hard assets.
Throughout history, hard assets have been the purest form of money and increased an investor’s wealth and security.
Now is the time to consider adding to your holdings and making physical Gold, Silver and Platinum the cornerstone assets in your long-term, diversified wealth accumulation strategy.
This publication has been prepared for the GBA Group Companies. It is for education purposes only and should not be considered either general of personal advice. It does not consider any particular person’s investment objectives, financial situation or needs. Accordingly, no recommendation (expressed or implied) or other information contained in this report should be acted upon without the appropriateness of that information having regard to those factors. You should assess whether or not the information contained herein is appropriate to your individual financial circumstances and goals before making an investment decision, or seek the help the of a licensed financial adviser. Performance is historical, performance may vary, past performance is not necessarily indicative of future performance. Any prices, quotes or statistics included have been obtained from sources deemed to be reliable, but we do not guarantee their accuracy or completeness.