We are endeavouring to deal with clients but have been inundated by the volume of business, which means we are unable to guarantee immediate responses. Please bear with our staff during this busy period.
Last week’s price action in the precious metals complex was characterized by increased volatility and intraday swings around technical support levels.
These price patterns are not uncommon as the protracted bull markets in Gold, Silver and Platinum take a pause and revert into a high-level consolidation phase.
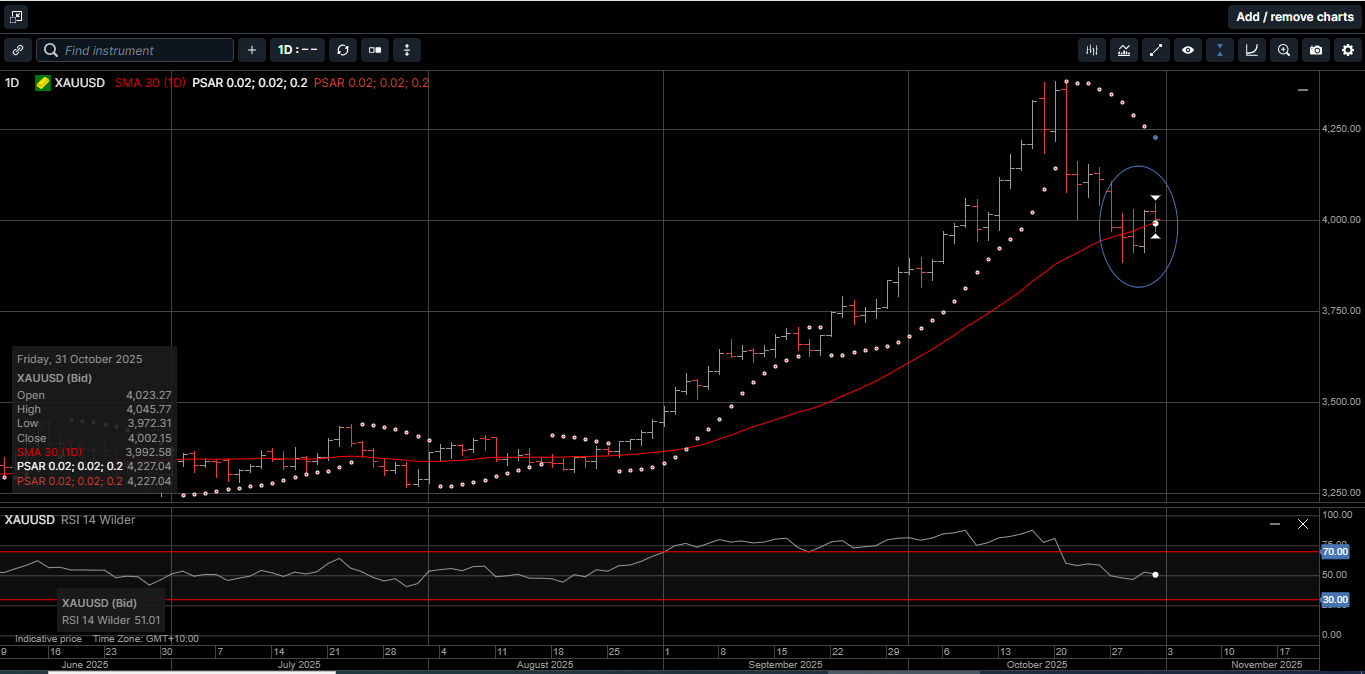
Physical Gold priced in USD started the week under selling pressure and swung in a 6.5% range from high to low as the week progressed. The yellow metal recovered somewhat to finish the
week 2.6% lower at $4002.00.
As illustrated on Chart 1, the USD Gold price traded on both sides of the 30-Day Moving Average (DMA) during four of the five trading sessions last week.
Chart 1 USD Gold 30 DMA
This chart pattern suggests the short-term overbought conditions present in the market two weeks ago are alleviating and allowing upside momentum to rebuild.
A weekly close above $4140.00 would improve the technical tone and suggest a durable low is in place at $3885.00.
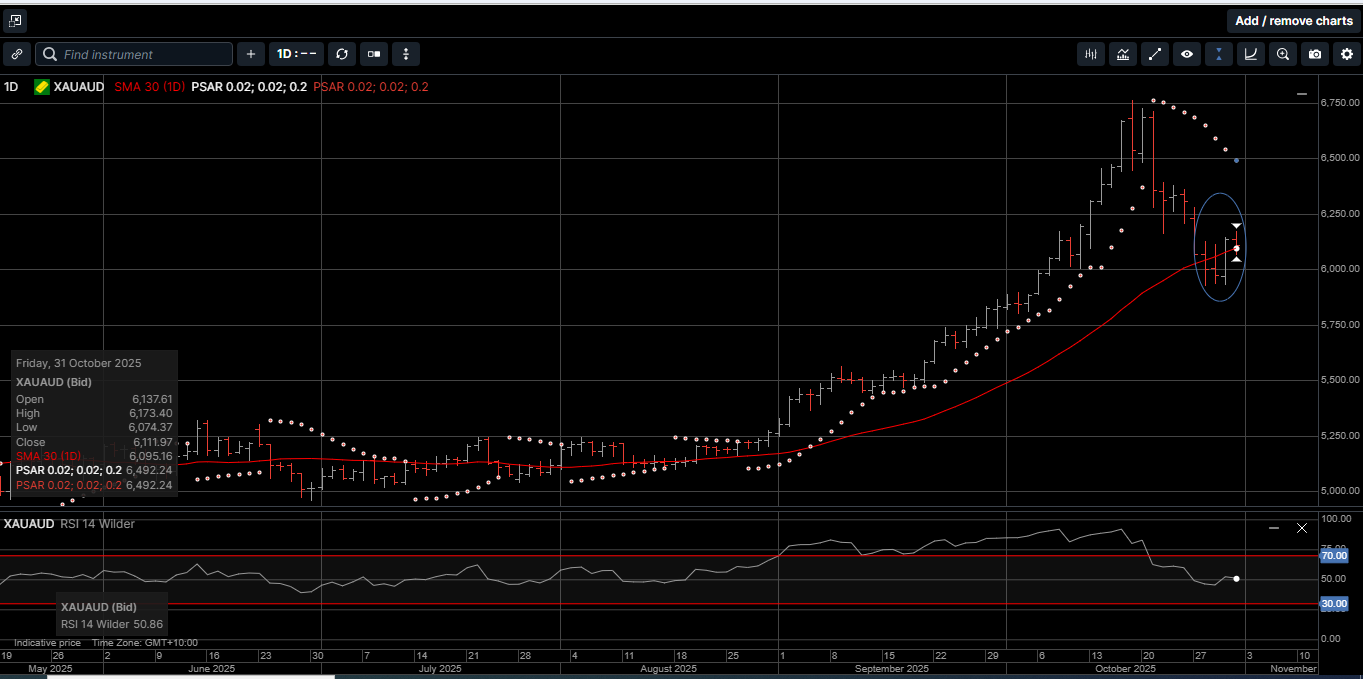
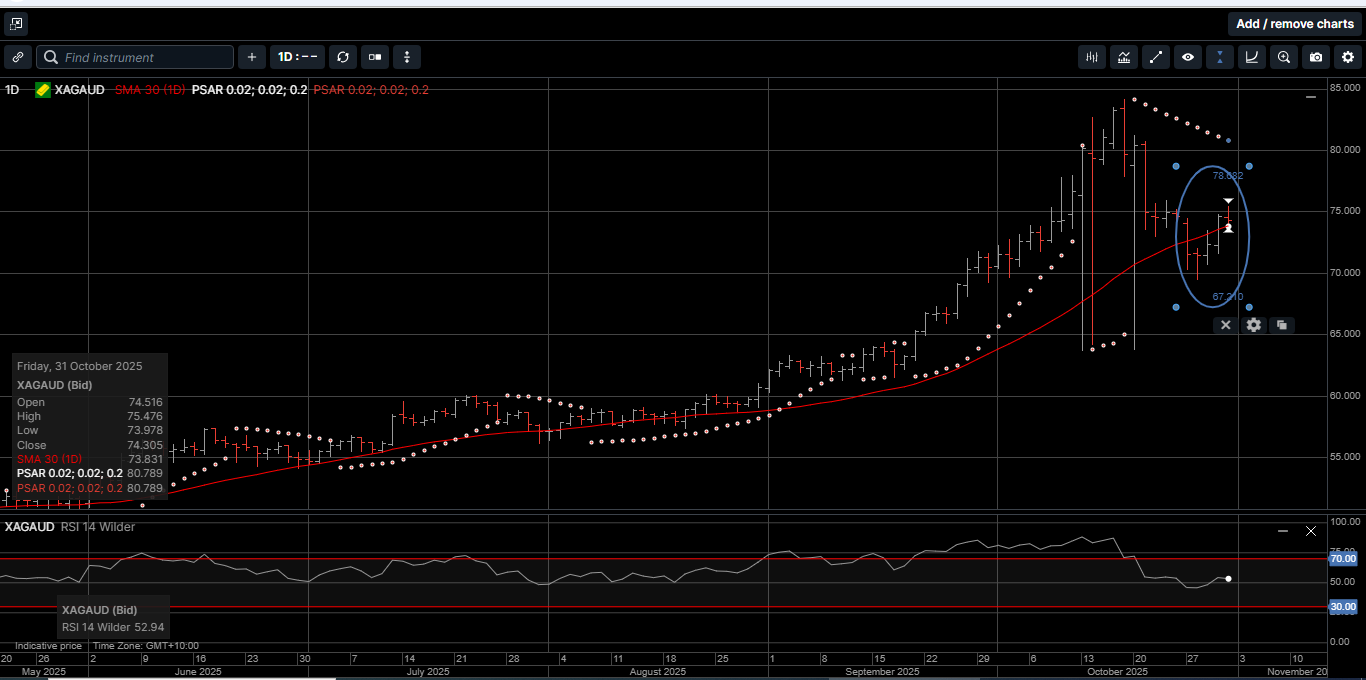
Gold denominated in AUD traded in a 6.7% range and closed out the week with a 3.1% loss at $6110.00. As shown on Chart 4, AUD Gold also frayed both side of its 30 DMA with an upside bias.
From a technical perspective, a weekly close above $6360.00 would give scope for range extension higher.
Physical Silver priced in USD traded in a 7.7% weekly range from high to low and tagged a one-month low at $45.50 before recovering to finish the week seven cents higher at $48.60. A weekly close above $50.60 would suggest a quick test of the $52.00 handle.
Silver denominated in AUD slipped 6.1% lower last Tuesday and hit $69.55 before rebounding higher to close out the week with a fractional loss at $74.30. As shown on Chart 5, AUD Silver traded on both sides of the 30 DMA with a firm close into the weekend.
The Gold versus Silver ratio fell 2.8% in favor of Silver to close at 82.15. This means it takes 82.15 ounces of Silver to equal the price of one ounce of Gold. We expect the ratio to continue to trade lower as Silver outperforms Gold over the longer term.
Physical Platinum prices covered a whopping 8.2% from high to low last week and finished 2.1% lower at $1570.00. The price action remains corrective and a weekly close above $1660.00 is needed to confirm the resumption of the uptrend.
The main market event last week was the US FOMC interest rate decision.
The FOMC voted on Wednesday to cut the FED Funds target rate another 25 basis points to 3.75% to 4.0%, after cutting by 25 basis points in September, and by 100 basis points in October of 2024.
The data-dependent FED made this decision based on a lack of data due to the government shutdown, and what little data it got showed further accelerating inflation.
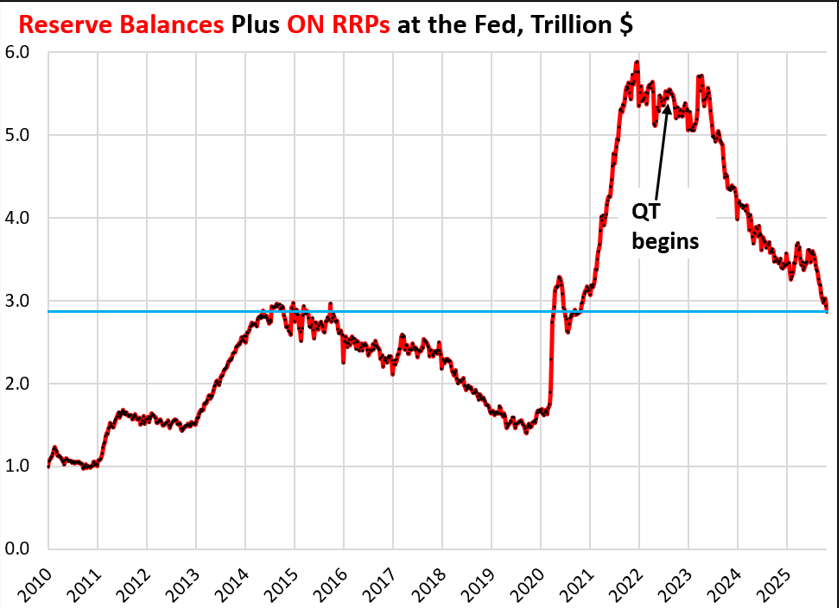
They also announced that the FED’s balance sheet reduction operation known as Quantitative Tightening (QT) would come to an end.
During the press conference, FED Chief Jerome Powell confirmed that the balance sheet would remain flat, as reserves continue to shrink and their Treasury bond holdings expire.
Mr. Powell also went out of his way to downplay the certainty of another rate cut in December, even though the forward markets have priced in a 65% chance of another 25-basis point cut.
As shown on Chart 2, since 2022 the FED’s balance sheet has contracted by $3 trillion to just about the exact level seen at the end of the Quantitative Easing (QE) operations from 2012 to 2014.
Chart 2 FED balance sheet
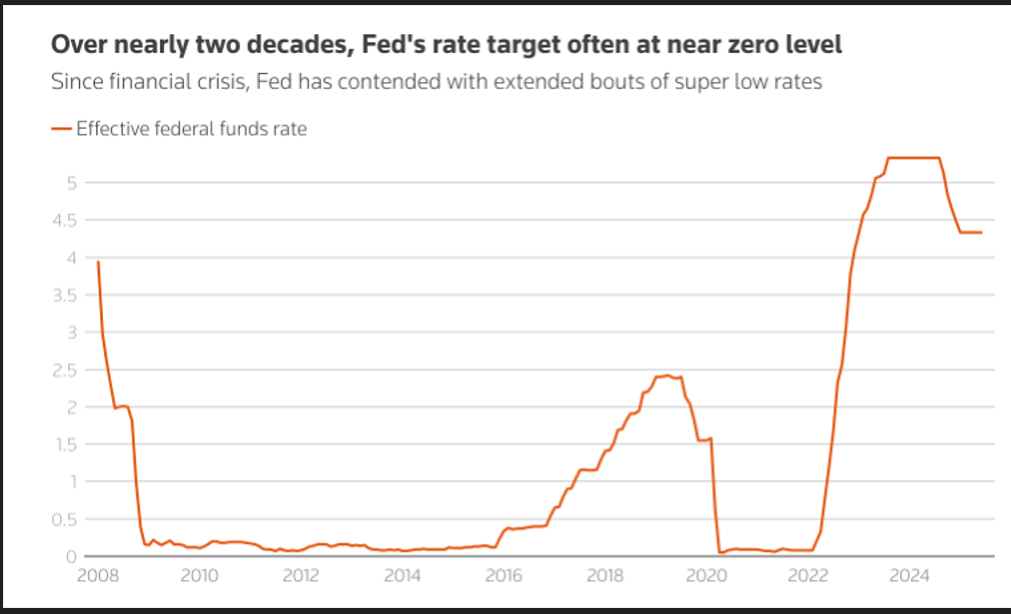
Chart 3 shows that the FED FUNDS rate cycle has about another 200 basis points of easing to reach a reasonable neutral level over a 20-year timeframe.
Chart 3 FED Funds rate
It’s important to point out that when the FED lowers the FED FUNDs rate, they are only directly influencing interest rate levels on short-term bonds; 30 days out to one year in duration.
In contrast, when the FED engages in QE operations, they purchase Treasury paper with durations from five to 10 years, which not only puts downside pressure on the bond yields, but also stabilizes the market to reduce systemic risk.
Reading between the lines, it’s the risk in the longer end of the US Treasury market that keeps the FED awake at night.
The fear is that interest rates could spike higher as other central banks, institutions and private investors switch from buying paper debt to buying the security of safe haven hard assets.
In other words, the FED has stopped QT, so they can prepare the market for another round of QE, which could have an asymmetrically positive impact on Gold, Silver and Platinum prices over the medium to longer term.
In short, as we head into the home stretch for 2025, the global economy is not in crisis, but it is in a precarious position.
It seems as though the financial tectonic plates are shifting, and the old maps of paper asset investing no longer apply.
The challenge for long-term investors is how to navigate a financial world where the rules are being rewritten in real time.
It’s been proven throughout time that hard assets increase wealth security during times of economic uncertainty.
Now is the time to consider making Gold, Silver and Platinum the cornerstone assets in your long term, diversified wealth creation portfolio.
Chart 4 Gold AUD
Chart 5 Silver AUD
This publication has been prepared for the GBA Group Companies. It is for education purposes only and should not be considered either general of personal advice. It does not consider any particular person’s investment objectives, financial situation or needs. Accordingly, no recommendation (expressed or implied) or other information contained in this report should be acted upon without the appropriateness of that information having regard to those factors. You should assess whether or not the information contained herein is appropriate to your individual financial circumstances and goals before making an investment decision, or seek the help the of a licensed financial adviser. Performance is historical, performance may vary, past performance is not necessarily indicative of future performance. Any prices, quotes or statistics included have been obtained from sources deemed to be reliable, but we do not guarantee their accuracy or completeness.
Share This Article
If you would like to stay informed about up to the minute pricing, market news and specials, subscribe here.