We are endeavouring to deal with clients but have been inundated by the volume of business, which means we are unable to guarantee immediate responses. Please bear with our staff during this busy period.
The US Federal Reserve (FED) followed the consensus last week and lowered the FED FUNDS target by 25 basis points to between 3.5% and 3.75%.
The decision for the 25-basis point rate cut was not unanimous.
In fact, with two FED governors voting for no rate cut, and one voting for 50 basis points of easing, the 9 to 3 vote leaves the FED policy board the most divided in over two decades.
The FED also announced the return of their balance sheet expansion operations via monthly T-Bill purchases of at least $40 billion per month effective immediately.
Monetary policy purists will refer to this new wave of balance sheet expansion as Reserve Management Purchases; most other people in the market will call it the restart of Quantitative Easing (QE).
Regardless of the nomenclature, the growing uncertainty of future policy directives within the fractured FED, combined with the resumption of direct cash injections into the banking system are fundamentally bullish for long-term Gold, Silver and Platinum prices.
Physical Gold priced in USD hit a two-month high of $4355 in early London trade last Friday before sliding lower into the NY close to settle 2.4% higher at $4300.00.
Gold denominated in AUD reached the $6500.00 handle for the first time in two months, but reverted lower into the weekend to close up 2.2% at $6456.00.
Gold in both currencies have bullish technical chart structures and rising momentum indicators, which suggest a high probability of an upward price bias into the end of the year.
Physical Silver based in USD raced to a new all-time high at $64.65 before a wave of selling on Friday pushed the market lower on the day. For the week, Silver rose by 6.2% and closed at $61.95.
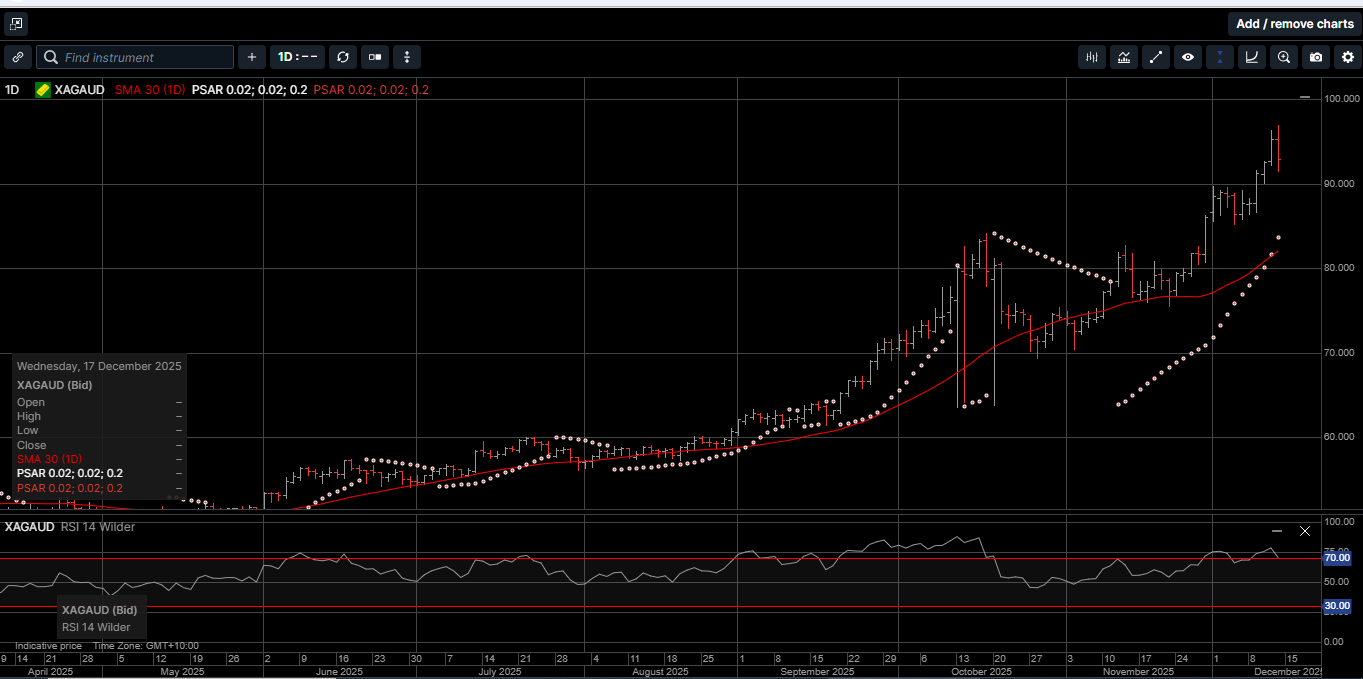
Silver denominated in AUD also reached a new all-time of $96.95 before slipping lower and ending the week up 5.9% at $87.77.
Silver in both USD and AUD have had strong rallies over the last three weeks. Last Friday’s sharp intraday reversal lower suggests a period of high level consolidation could evolve in the short-term before a continuation of the uptrend.
Initial support levels are at USD $59.40 and AUD $86.50.
The Gold versus Silver ratio hit a 4.5-year low in favor of Silver at 66.50 and closed the week at 69.32. This means it takes 69.32 ounces of Silver to equal the price of one ounce of Gold.
We would not be surprised to see Gold outperform Silver over the near-term, which could push the ratio back into the 71.50 area.
Physical Platinum hit a 14-year high of $1778.00 and finished the week 6.5% higher at $1741.00. With the daily RSI at 66.50 and rising, higher levels look to be the path of least resistance.
The fallout from last week’s FOMC meeting has been two-fold: the rate cut was expected, the balance sheet expansion of $40 billion per month, not so much.
It seems clear that both the FED and the Treasury department are now desperately embarking on an attempt to lower US interest rates by purchasing US T Bills and short dated Treasuries below 3 years of maturity.
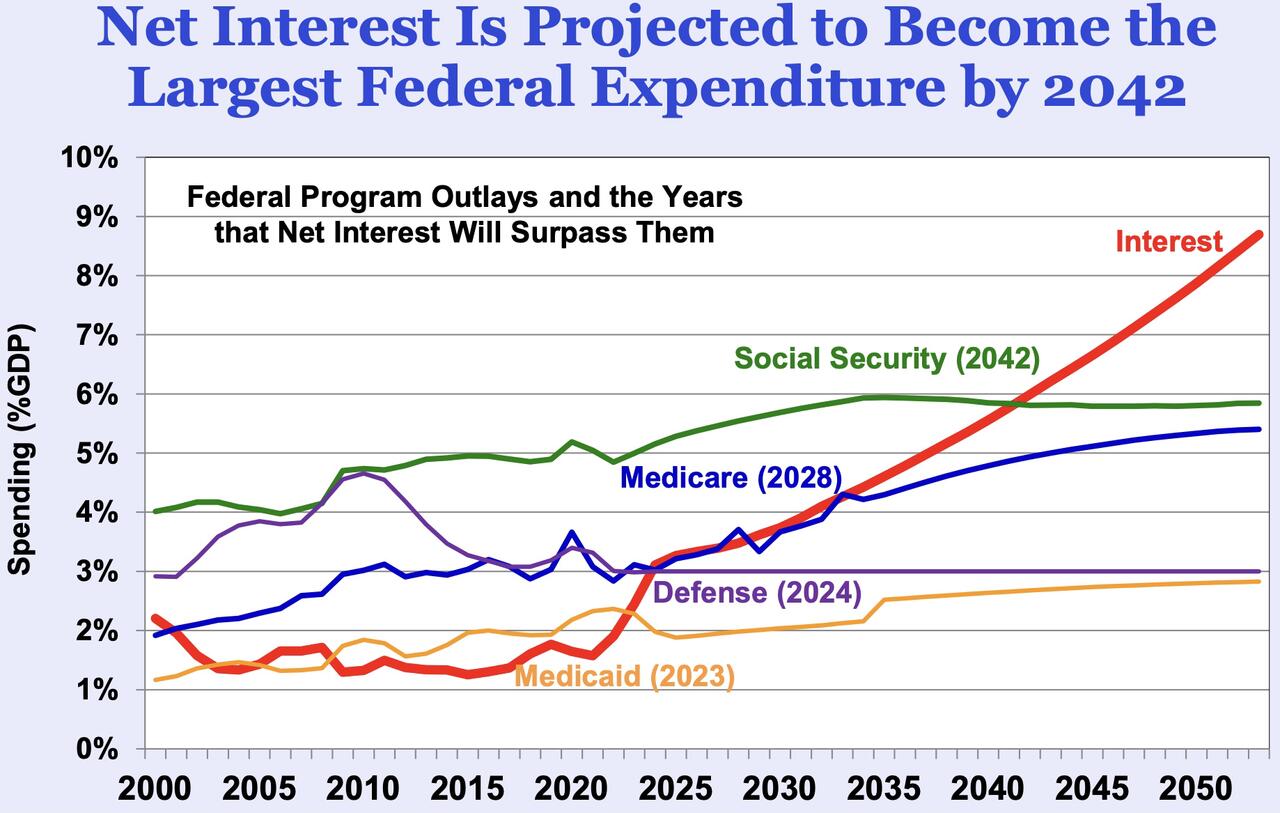
Chart 1 interest payments
This was an unexpected policy shift but is very much required. US interest rate settings are way too high for comfort in this situation, especially, as illustrated on Chart 1, the amount of interest paid on the deficit.
Because the purchases are being made by the Treasury in short-term securities and not by the Federal Reserve in longer-term securities, by definition, this is not pure QE.
In the past, QE has targeted interest rates further out on the maturity curve.
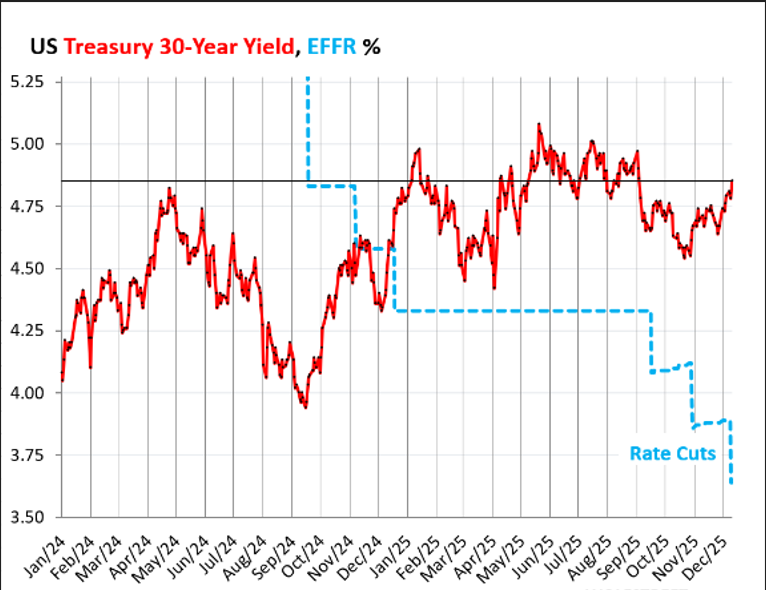
Chart 2 30 year yields versus
As shown on Chart 2, the FED FUNDS rate has dropped by 125 basis points since the beginning of 2025. However, the yield on US 30-year bond has drifted higher.
With the annual cost of servicing the US deficit now over $1.2 trillion, neither the FED nor the Treasury department want to see longer-term interest rate trading higher.
Remember that the FED ended their Quantitative Tightening operations at the October FOMC meeting.
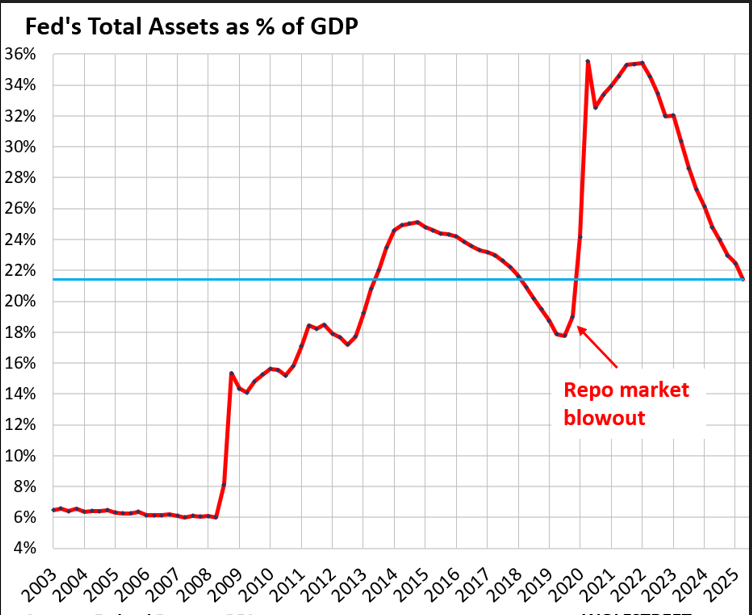
Chart 3 FED balance sheet
And, as shown on Chart 3, the balance sheet ratio is down to levels that triggered stress in the US repo markets back in 2020.
So, whether the financial media call it Reserve Management Purchases or QE, the goal of the US government is yield curve manipulation to suppress the risk of a spike in the long end of the treasury curve, which could blow up the US mortgage market and sharply increase debt servicing costs.
It seems no government in advanced economies around the world want to cut spending, even despite evidence indicating a widespread loss of confidence in their solvency.
The US and all of the other G-10 economies are facing government debt ratios above 100% of GDP, growing primary budget deficits and few politically viable fiscal options to even trim spending.
As such, we are experiencing an historical monetary change that will have long-term implications and reward those investors with a long-term hard asset strategy.
Global central banks, financial institutions and provident investors have stopped believing in paper promises and demand the safe haven and security of real money assets like physical Gold, Silver and Platinum.
Now is the time to prepare for more financial uncertainty and consider adding to your holdings of hard assets as part of a diversified wealth creation strategy.
Chart 4 Gold AUD
Chart 5 Silver AUD
This publication has been prepared for the GBA Group Companies. It is for education purposes only and should not be considered either general of personal advice. It does not consider any particular person’s investment objectives, financial situation or needs. Accordingly, no recommendation (expressed or implied) or other information contained in this report should be acted upon without the appropriateness of that information having regard to those factors. You should assess whether or not the information contained herein is appropriate to your individual financial circumstances and goals before making an investment decision, or seek the help the of a licensed financial adviser. Performance is historical, performance may vary, past performance is not necessarily indicative of future performance. Any prices, quotes or statistics included have been obtained from sources deemed to be reliable, but we do not guarantee their accuracy or completeness.
Share This Article
If you would like to stay informed about up to the minute pricing, market news and specials, subscribe here.