We are endeavouring to deal with clients but have been inundated by the volume of business, which means we are unable to guarantee immediate responses. Please bear with our staff during this busy period.
Financial markets responded to the reopening of the US Government with wide price swings combined with a general “Risk Off” sentiment.
Much of the volatility stemmed from contradictory comments from FED officials regarding interest rate policy as well as conflicting US employment data.
As a result, some of the most popular trades on Wall Street and the crypto space fell sharply while precious metals prices were supported within recent ranges.
Interestingly, the theme of risk asset rotation has been on the rise recently and could be the catalyst for the next leg higher in Gold, Silver and Platinum prices.
Physical Gold priced in USD was confined within the previous week’s range, on both sides of the 30-Day Moving Average (30 DMA) and finished the week fractionally lower at $4064.00.
Chart 1 Gold AUD
As illustrated in the circled section of Chart 1, Gold denominated in AUD traded on both sides of the 30 DMA with an upward bias and ended the week with a 1.0% gain at $6290.00. This is generally a bullish chart structure and suggests higher prices over the medium term.
Physical Silver based in USD bounced off a two-week low at $48.63 to reclaim the $50.00 handle as well at the 30 DMA to post a 1.4% loss for the week at $50.05.
Chart 2 Silver AUD
As shown on Chart 2, Silver denominated in AUD has traded above the 30 DMA during every session since November 10th and finished the week unchanged at $77.35. AUD Silver looks to be building upside momentum for a move back into the $80.00 handle.
The Gold versus Silver ratio moved 1.3% in favor of Gold to close at 81.20. This means it takes 81.20 ounces of Silver to equal the price on one ounce of Gold.
Physical Platinum slid to a two-month low at $1489.00 before recovering into the end of the week to finish 1.8% lower at $1516.00. Platinum remains in a Flag pattern and needs to trade above $1583.00 to improve the technical tone.
As mentioned above, there doesn’t seem to be a strong consensus from the US FED governors regarding next month’s FOMC meeting.
Comments from New York Fed John Williams and Governor Stephen Miran were dovish, prompting investors to increase the odds of a 25-bps rate cut at the December meeting.
Conversely, Boston Fed governor Susan Collins and Dallas governor Lorie Logan opted to maintain a restrictive policy, suggesting that the central bank hold rates unchanged at the target of 3.75% to 4.00%.
The forward FED FUNDS market closed the week reflecting a 70% chance of a December rate cut, a sharp jump from around 30% earlier in the week.
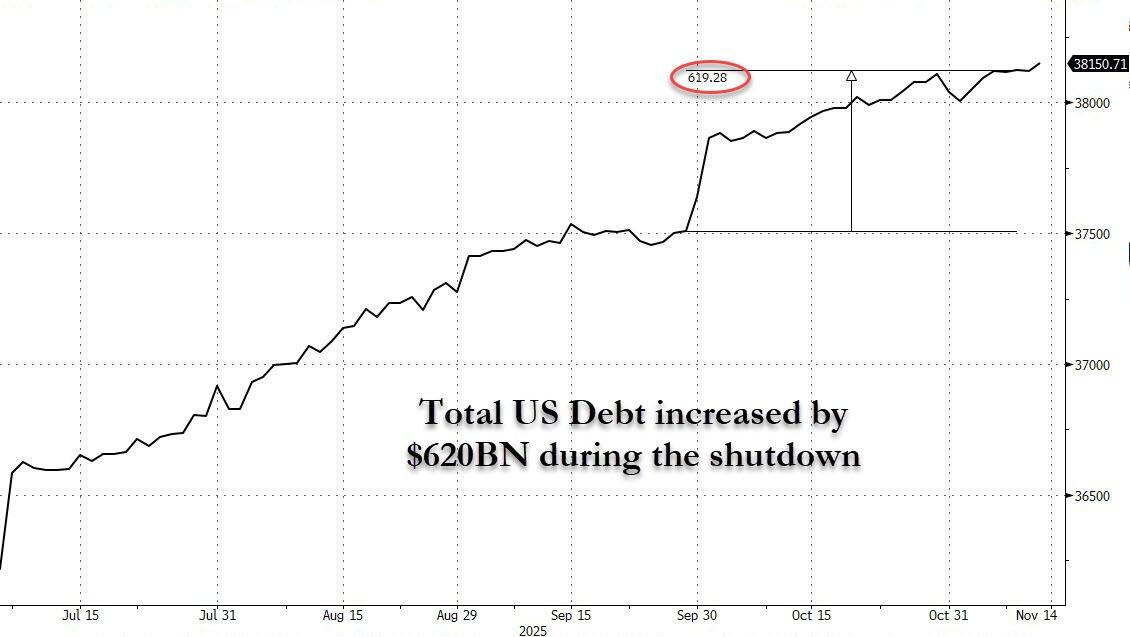
Chart 3 US Debt during shutdown
As shown on Chart 3, The US debt rose by over $600 billion during the 43-day government shutdown.
The combination of rising debt and the uncertainty of another FED FUNDS rate cut in December has weighed on the Wall Street Indexes.
Since the beginning of November, the Dow Jones 30 Index is 2.3% lower, the S&P 500 is down 3.7% and the NASDAQ has lost 6.7%.
During the same period of time, Gold has risen by 1.5%, Silver has gained 2.7% , and Platinum is unchanged.
The point is that this price action could be the early days of a Capital Rotation from paper assets to hard assets.
A capital rotation is when money leaves overvalued stock markets and moves into hard assets like Gold, Silver and Platinum.
Historically, these periods have seen hard assets rise substantially, while major stock indexes are repriced by anywhere from 50%–80% lower.
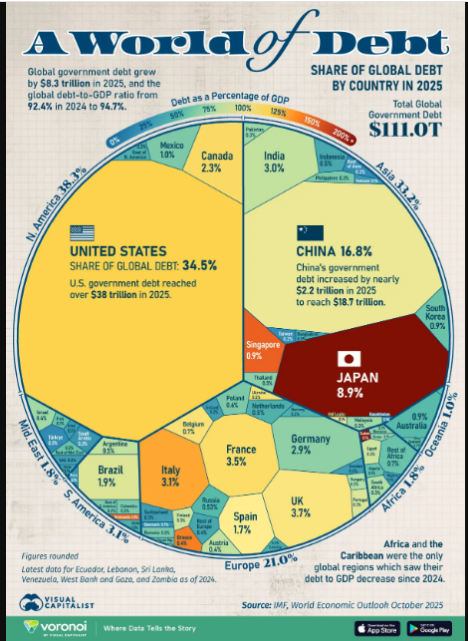
Chart 4 World Debt
As shown on Chart 4, the total world debt is estimated to be an eye watering $111 trillion.
In this environment, it’s no surprise that central banks, money managers and individual investors have all looked to hard assets as a store of value and safe haven to hedge market uncertainty.
Owning physical Gold, Silver and Platinum as part of a diversified portfolio can increase wealth security and lower the risk concentration of traditional paper assets.
With the precious metals complex currently in a consolidation phase, now is the time to consider adding to your existing Gold, Silver and Platinum holdings.
This publication has been prepared for the GBA Group Companies. It is for education purposes only and should not be considered either general of personal advice. It does not consider any particular person’s investment objectives, financial situation or needs. Accordingly, no recommendation (expressed or implied) or other information contained in this report should be acted upon without the appropriateness of that information having regard to those factors. You should assess whether or not the information contained herein is appropriate to your individual financial circumstances and goals before making an investment decision, or seek the help the of a licensed financial adviser. Performance is historical, performance may vary, past performance is not necessarily indicative of future performance. Any prices, quotes or statistics included have been obtained from sources deemed to be reliable, but we do not guarantee their accuracy or completeness.
Share This Article
If you would like to stay informed about up to the minute pricing, market news and specials, subscribe here.