Central Banks Are Back On The Bid
by Joel Cameron
Posted on 29 Jun, 2026 in
Markets enter July with a ceasefire in the Middle East that nobody quite trusts.
The 60-day de-escalation between Washington and Tehran has done its job on paper; traffic in the Strait of Hormuz has increased, crude oil prices have dropped, and risk assets have firmed.
During last week’s trade, comments from FED officials about higher interest rates were offset by reports that central banks were back in the market as net buyers of Gold.
The sharp rebound from the mid-week lows suggest that retail investors are following the central banks and buying the dips in Gold, Silver and Platinum.
Physical Gold priced in USD hit a seven-month low at $3960.00 on Wednesday morning before recovering to close 1.5% lower for the week at $4090.00.
We are seeing bullish divergence on the Relative Strength Index (RSI) with a reading of 30.10 and the upside pivot level at $4220.00.
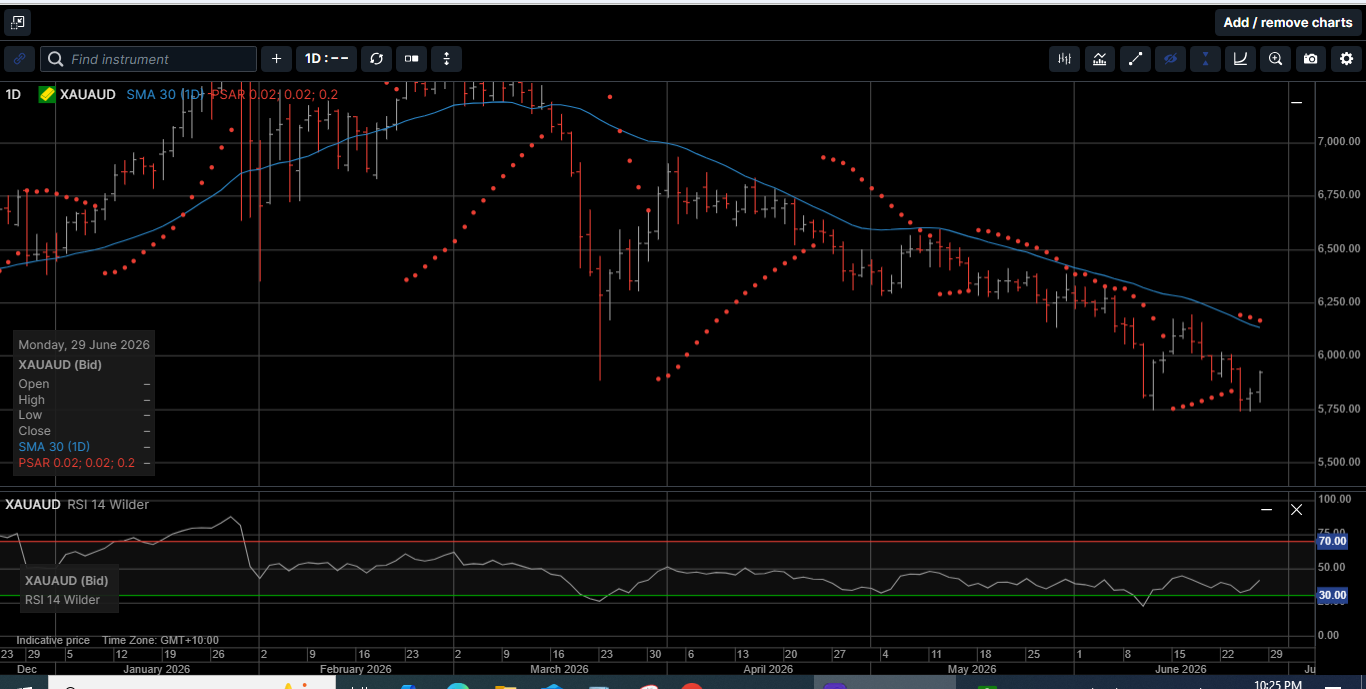
Gold denominated in AUD has formed a triple bottom pattern at $5750 and closed out the week 1 dollar lower at $5926.00.
AUD Gold was supported somewhat by the 1.6% loss in the AUD/USD last week.
Physical Silver priced in USD slipped to a six-month low at $55.50 on Wednesday but recovered to finish the week 8.6% lower at $59.25.
USD Silver hit a low of 27.60 on the daily RSI and needs to close above $67.20 to suggest a durable low is in place.
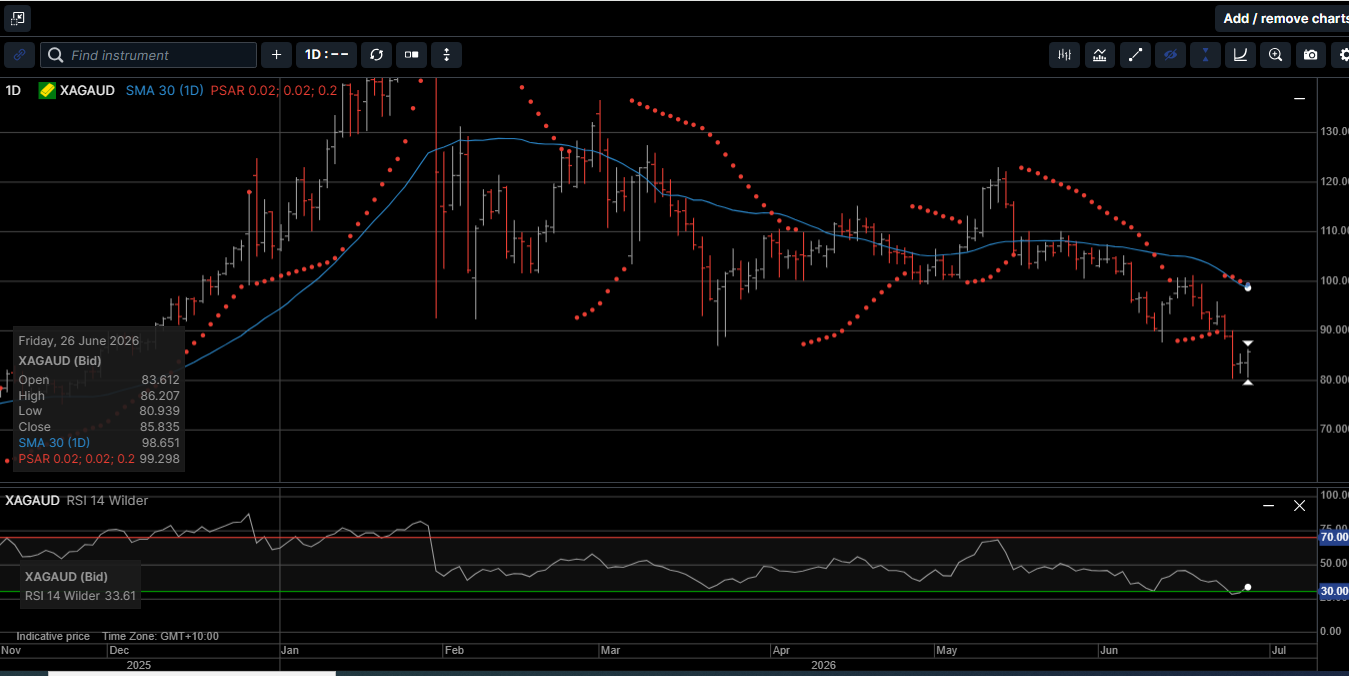
Silver denominated in AUD fell to a six-month low at 80.70 and closed out the week 7.1% lower at $85.80. The daily RSI reading at 28.40 suggests an oversold condition with asymmetrical upside potential.
The upside pivot level is $93.15 with key support at $80.20.
The Gold versus Silver ratio reached a four-month high at 71.40 before drifting lower to close out the week 7.6% higher in favor of Gold at 68.90.
That means it takes 68.90 ounces of Silver to equal the price of one ounce of Gold.
With a daily RSI reading showing overbought at 73.40, we expect the ratio to trade lower as Silver outperforms Gold over the medium-term.
Physical Platinum dropped to a seven-month low at $1546.00 before bouncing to close out the week 2.7% lower at $1621.00.
With a daily RSI reading of 29.00, the $1550 level looks to offer solid support and a close above $1715.00 would improve the technical outlook.
Over the last four years, solid buying from global central banks has offered one of the strongest pillars of support for physical Gold.
And it now looks like central banks are increasing their commitment to the safe haven metal.
According to the World Gold Council’s (WGC) newly released 2026 Central Bank Gold Reserves Survey, monetary authorities have been buying an average of 1,000 tons annually over the past four years, which is double the pace seen in the prior decade.
Nearly 90% of survey respondents believe total sovereign Gold holdings will climb again over the next 12 months, and 45% expect Gold purchases to surpass the record-breaking levels of 2022.
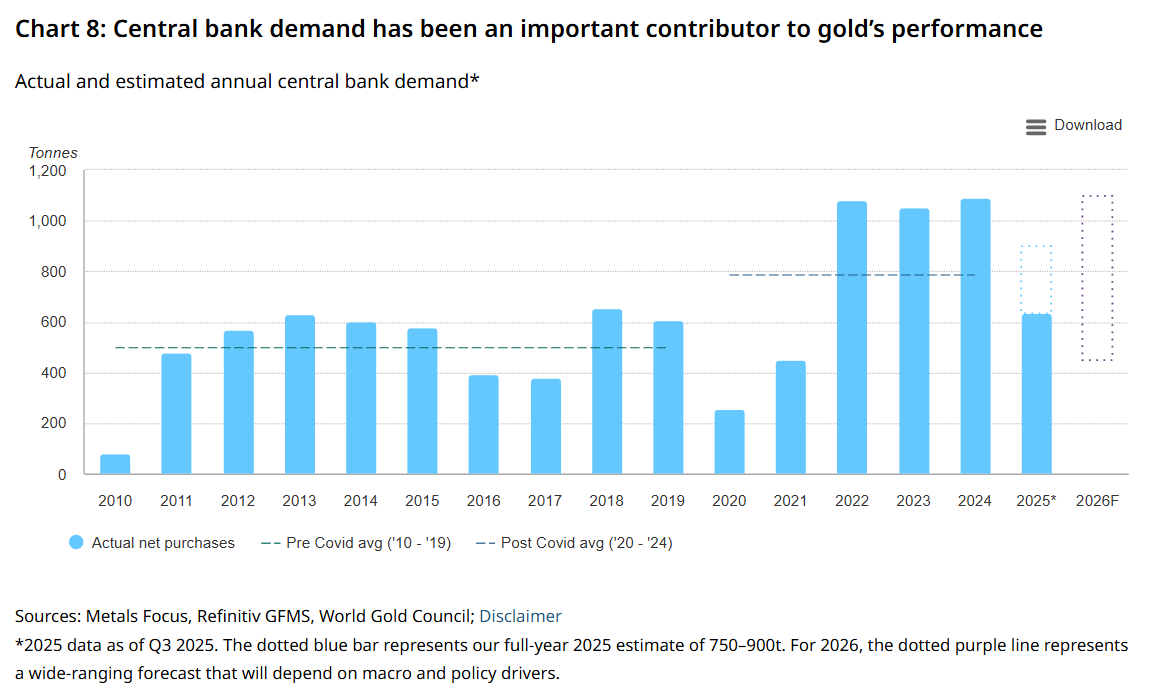
As illustrated on Chart 1, central bank demand in 2026 is expected to be the strongest in more than 15 years.
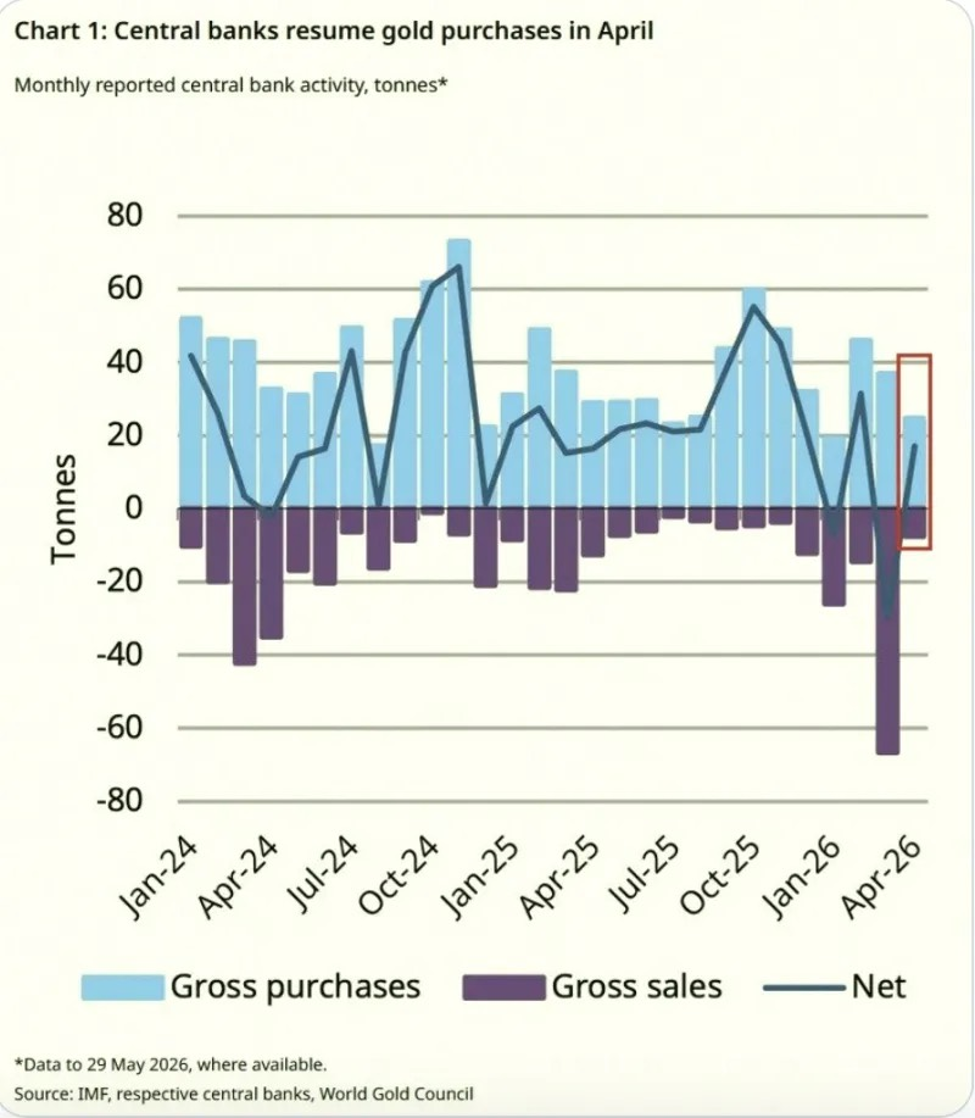
Further, as shown on Chart 2, the increase in central bank accumulation follows a seasonal pattern of more aggressive net buying in the second half of the calendar year.
The WGC survey, conducted from February 5th to May 19th, included 76 central-bank participants, and paints a picture of growing unease with the existing reserve asset portfolio mix.
Asked to look five years ahead, 84% anticipate Gold’s share of global reserves will be larger, while 74% expect a moderate or significant decline in the dominance of the USD as a sovereign reserve asset.
Interest-rate uncertainty, geopolitical instability, and lingering inflation are the chief forces shaping today’s reserve decisions. With consumer prices still well above pre-pandemic levels, caution toward fiat currency assets is hardly surprising.
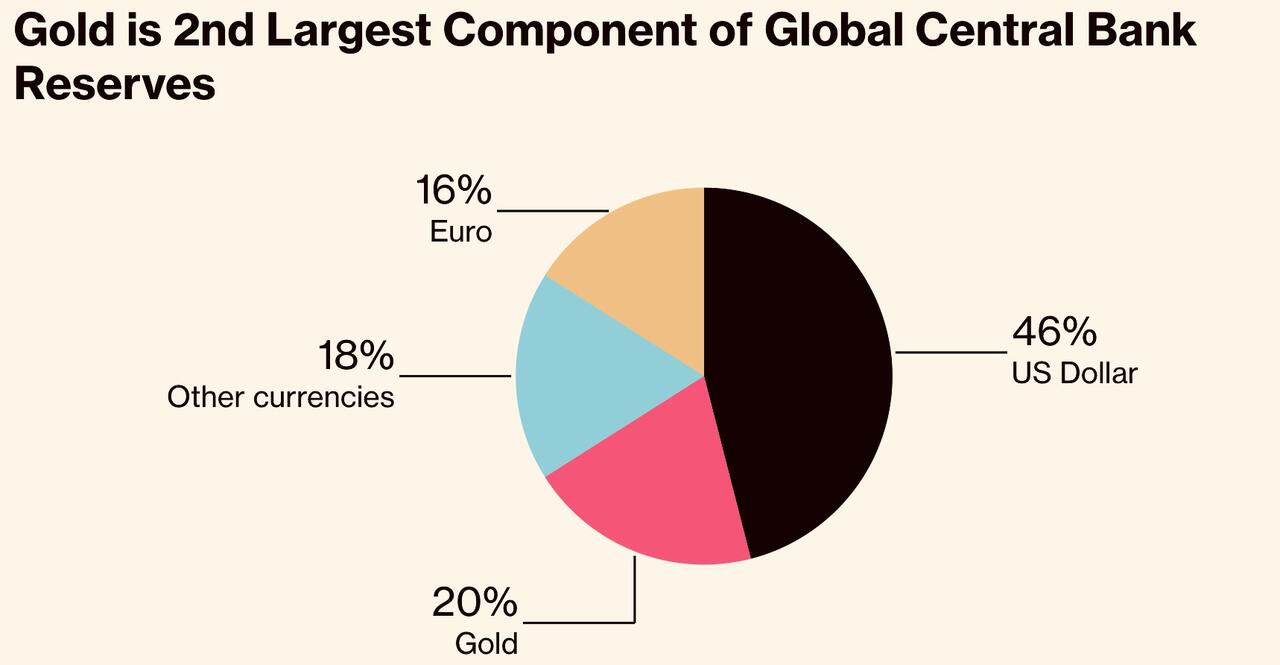
As shown on Chart 3, Gold is already the second largest central bank reserve asset just behind the USD.
One can only imagine the strength of the Gold rally as the yellow metal chips away at the USD as the preferred reserve asset over the next several years.
One of the strongest signals that Gold functions as a genuine store of value is how central banks treat it.
These institutions manage national wealth across decades and generations. Their buying behavior reflects long-term thinking, not short-term speculation.
These central banks are not chasing momentum. They are diversifying away from currencies they believe are vulnerable to debasement over time.
Whether policymakers in the world’s developed economies heed this growing vote of no confidence remains to be seen.
For now, central banks themselves are sending a clear signal: Gold, and other hard assets, are back at the heart of reserve strategy, and the trend shows little sign of reversing.
When economic and geopolitical uncertainty permeate financial markets, holding real, physical assets can be the surest hedge to protect and grow your wealth.
As such, with this recent pullback in prices, now is the time to consider adding to your holdings of physical Gold, Silver and Platinum as part of your secure, long-term wealth creation strategy.
This publication has been prepared for the GBA Group Companies. It is for education purposes only and should not be considered either general of personal advice. It does not consider any particular person’s investment objectives, financial situation, or needs. Accordingly, no recommendation (expressed or implied) or other information contained in this report should be acted upon without the appropriateness of that information having regard to those factors. You should assess whether or not the information contained herein is appropriate to your individual financial circumstances and goals before making an investment decision or seek the help the of a licensed financial adviser. Performance is historical; performance may vary; past performance is not necessarily indicative of future performance. Any prices, quotes or statistics included have been obtained from sources deemed to be reliable, but we do not guarantee their accuracy or completeness.