Markets Brace for the US Election Results
Markets Brace For the US Election Results
In what has become a common pattern over the last two months, physical Gold and Silver prices posted their highs early in the week before slipping lower into the weekend. The technical picture in the precious metals complex remains bullish with widespread global demand acting as a primary driver for higher prices.
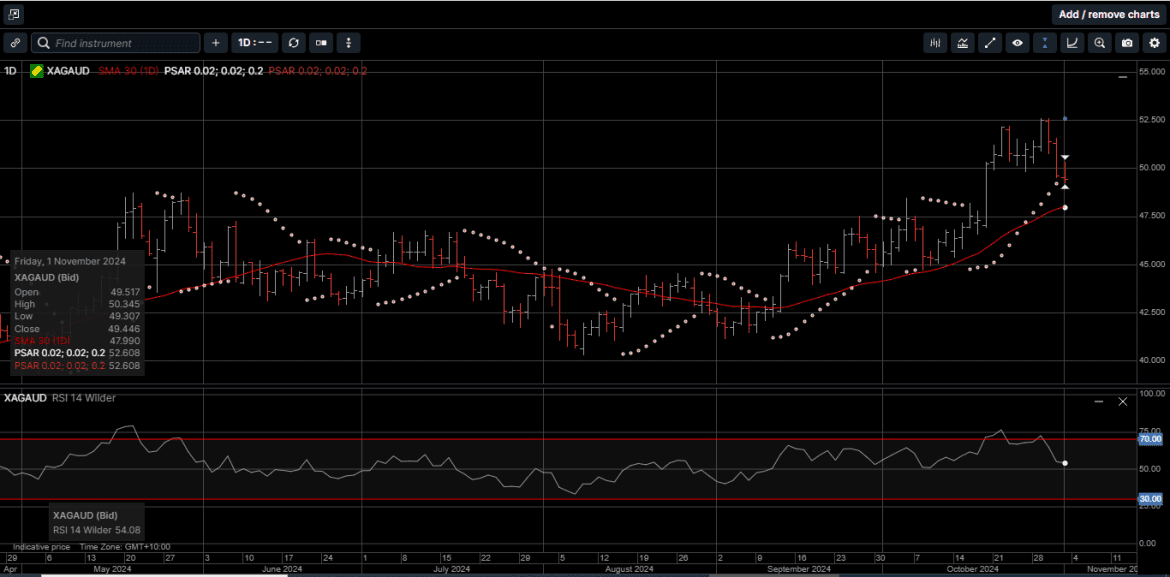
Gold priced in USD reached a new all-time high of $2790.00 last Wednesday and then reverted lower to close unchanged for the week at $2736.00. Gold denominated in AUD has rallied during 15 of the last 18 trading days and posted a new all-time high of $4257.00 before slipping back to finish the week fractionally higher at $4158.00. Physical Silver prices underperformed Gold for the second consecutive week with USD Silver sliding 3.7% to $32.44, while AUD Silver was down 3.1% to finish the week at $49.50.
With the US Presidential election on Tuesday and the FOMC meeting on Wednesday, it’s going to be a very busy week for financial markets. While we won’t venture a guess as to who the 47th US President will be, we are confident that the FOMC will follow up its September 50 basis-point rate cut with an additional 25 basis-points of easing this week.
With respect to the election result, we believe that regardless of who occupies the White House, Gold and Silver will extend the rally that started over a year ago and has made the precious metals complex one of the best returning asset classes. To put a finer point on this, the next President will inherit a deficit of over $35 trillion which, will underpin Gold prices, and both candidates have proposed policies which will increase the industrial demand for Silver.
If Ms. Harris wins the election, she is likely to extend the current Green Energy initiatives, while if Mr. Trump becomes the next POTUS, he has pledged to increase domestic automobile and computer chip production… Both of which are bullish for Silver.
It’s important to note that physical Silver prices, in both USD and AUD, have been rising steadily since late July. This technical aspect of the Silver markets suggests that Silver could outperform Gold over the medium term.
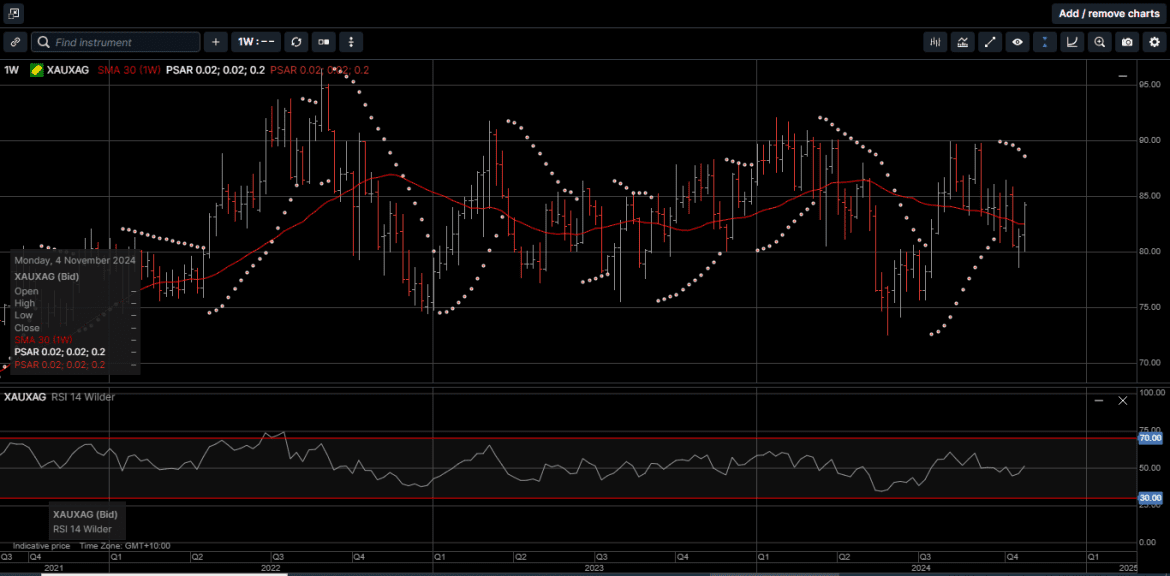
As illustrated on Chart 1, the Gold versus Silver ratio topped out around 91.50 in mid-February and then drifted as low as 73.50 in the middle of May. After dipping to a three-month low of 78.80 two weeks ago, the current ratio is 84.25. This means that in mid-February, it took 91.50 ounces of Silver to equal the price of one ounce of Gold. When the ratio fell to 73.50 on May 15th, that penciled out to nearly a 20% outperformance in favor of Silver.
From a geological perspective, there is 20 times as much Silver on the planet as there is Gold, so the ratio has a long way to adjust to fit that equation. One of the most widespread uses of Silver is in solar panels. Not only is the demand for solar panels growing, and likely to grow faster with a new Democrat administration, but the amount of silver used in each panel is also increasing. Industrial demand for Silver hit a record of 654.4 million ounces in 2023 and it is expected to hit new highs this year.
According to the Silver Institute in Washington D.C., ongoing structural gains from green economy applications are underpinned this surge in Silver demand. Silver is the best conductor of electricity compared to all other metals, which makes it a vital input in the production of solar panels.
To manufacture a solar panel, Silver is formed into a paste that is applied to the front and back of silicon photovoltaic cells. The front side collects the electrons generated when sunlight strikes the cell, while the back side helps to complete the electrical circuit. Each new generation solar panel uses approximately .75 ounces of Silver, while this is a relatively small amount, the total adds up quickly when you consider the number of panels produced each year.
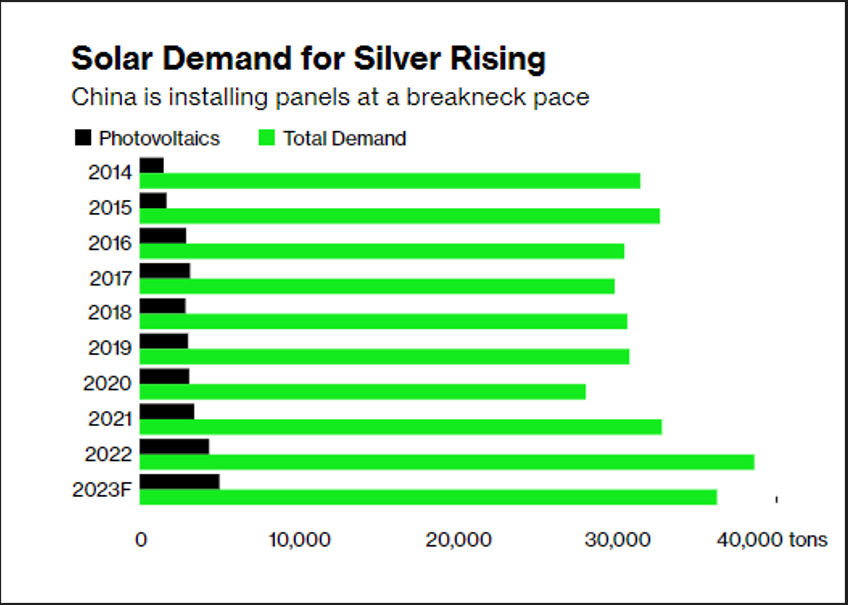
As shown on Chart 2, the solar industry used approximately 100 million ounces of Silver in 2023, accounting for about 14 percent of total silver demand. Several years ago, many analysts believed that the amount of Silver used in solar panels would decline over time with the development of new technologies.
In 2020, Passivated Emitter and Rear Cell (PERC) technology was the standard, accounting for virtually the entire solar market. A PERC solar panel uses about 10 milligrams of silver per watt. By 2022, PERC technology was being replaced by Tunnel Oxide Passivated Contact (TOPCon) cells. This advanced technology enhances the efficiency of solar cells by improving the way they handle electron flow.
With demand for solar power increasing along with the amount of Silver used in each panel, analysts believe that solar panel production will consume increasingly large amounts of Silver in the future. According to research by scientists at the University of New South Wales, solar manufacturers will likely require over 20 percent of the current annual Silver supply by 2027.
By 2050, solar panel production will use approximately 85–95 percent of the current global Silver reserves.
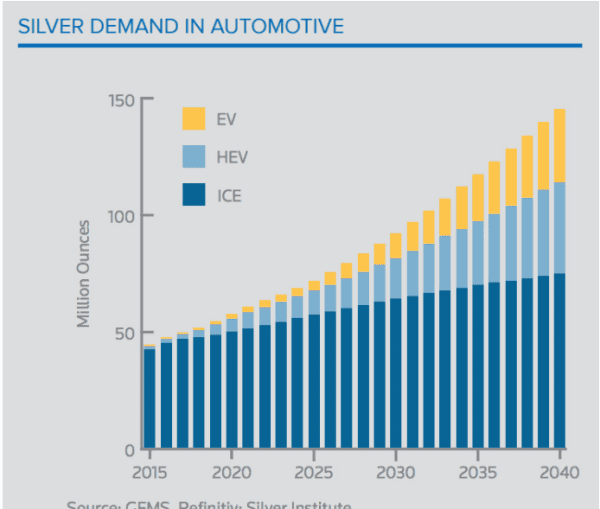
As illustrated on Chart 3, Silver demand for electric vehicles, hybrid electric vehicles and internal combustion systems is also expected to rise based on current projections.
We expect this automotive demand will be stronger with a Republican administration in office.
The physical Silver market is already running significant deficits with demand outstripping supply. In fact, the structural deficit in 2023 came in at 184.3 million ounces, this means investors could see much higher prices because of a significant supply squeeze in the coming years. It’s also important to remember that while industrial demand is an important factor driving the price, Silver is still fundamentally a monetary metal as such, the physical Silver price tends to track with Gold over time.
In short, if high government deficits, global economic uncertainty and simmering geopolitical tensions has made investors bullish on Gold, then it is reasonable to think that investors should be equally as bullish on Silver.
And as we have seen over the last eight months, Silver can sometimes outperform Gold in a Gold bull market. There are plenty of reasons why a growing number of investors are turning to the time-proven security and safety of Gold and Silver as the cornerstone of their wealth creation strategy.
With the precious metals complex building upside momentum over the course of 2024, now is the time to consider the benefits of adding to your Gold and Silver holdings before prices advance into the end of the year.
Chart 4 – Gold AUD
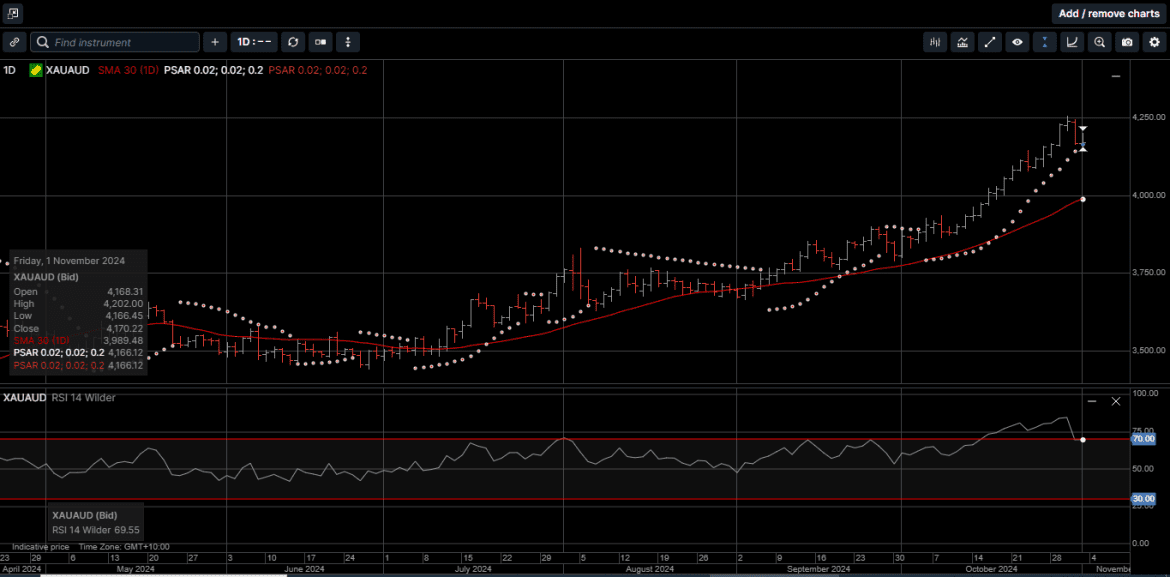
Chart 5 – Silver AUD
This publication has been prepared for the GBA Group Companies. It is for education purposes only and should not be considered either general of personal advice. It does not consider any particular person’s investment objectives, financial situation or needs. Accordingly, no recommendation (expressed or implied) or other information contained in this report should be acted upon without the appropriateness of that information having regard to those factors. You should assess whether or not the information contained herein is appropriate to your individual financial circumstances and goals before making an investment decision, or seek the help the of a licensed financial adviser. Performance is historical, performance may vary, past performance is not necessarily indicative of future performance. Any prices, quotes or statistics included have been obtained from sources deemed to be reliable, but we do not guarantee their accuracy or completeness.