Gold Hits $3600 as Bullish Momentum Remains Intact
Gold Hits $3600 as Bullish Momentum Remains Intact
The rally in the precious metals complex during August spilled over into September as Friday’s dismal US employment report fanned speculation for a series of interest rate cuts starting later this month.
As illustrated on Chart 1, the probability of the US central bank easing over the next several months took another leg higher after the lower-than-expected number of new jobs created.
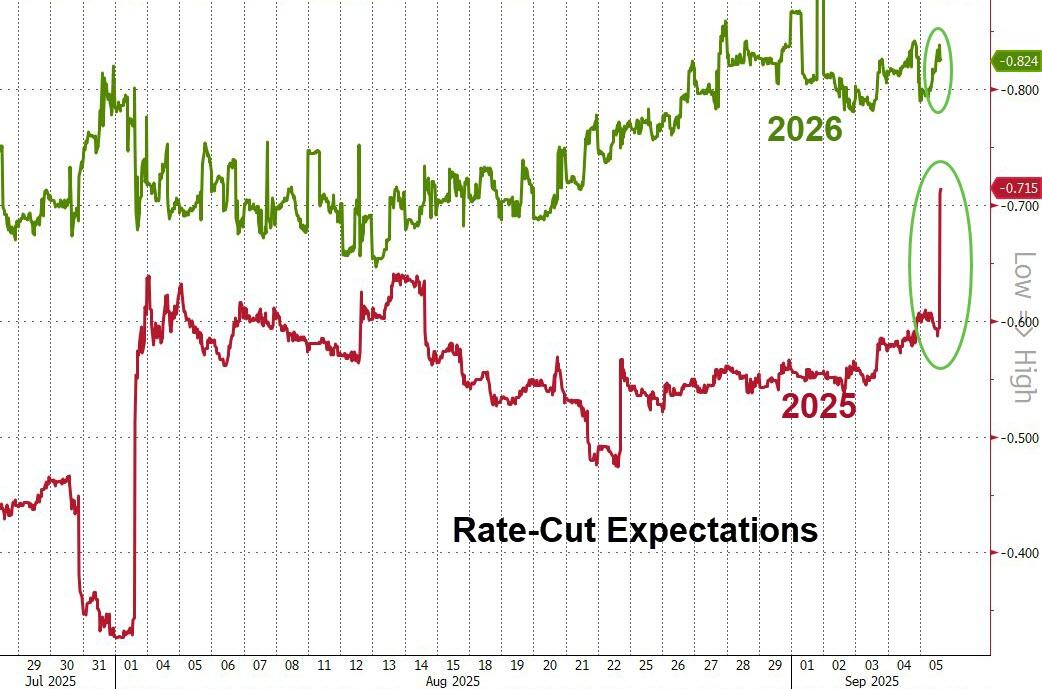
This extension of the lower rates narrative up to 75 basis points of easing was negative for the USD and bullish for Gold Silver and Platinum.
Physical Gold priced in USD rose 4.1% for the week, reached the $3600.00 level for the first time in history and posted a new all-time high close at $3586.00.
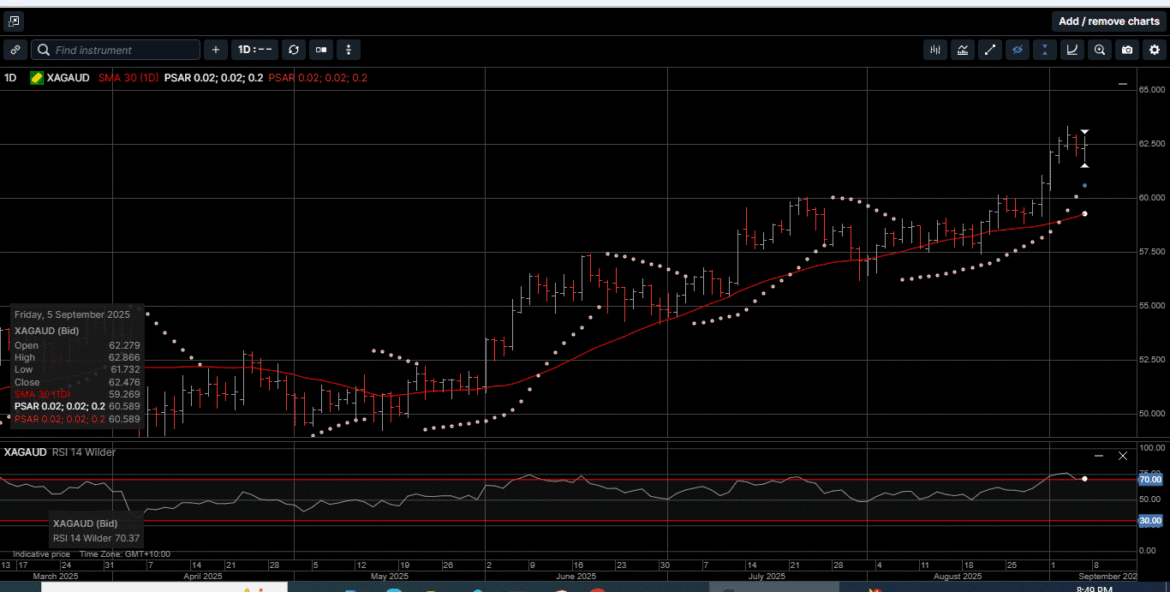
Gold denominated in AUD also reached a new all-time high at $5590.00 and ended the week 3.2% higher at a new all-time high weekly close at $5465.00.
The technical picture for Gold in both currencies appears to be approaching overbought territory on the daily charts.
This doesn’t mean that prices won’t move higher, but a period of consolidation prior to the FOMC meeting on September 17th would not be a surprise.
Physical Silver priced in USD came within a whisker of a 15-year high at $41.50 and finished the week with a 3.2% gain at $41.05.
Silver denominated in AUD posted a new all-time high at $63.33 before slipping lower in front of the weekend to close 2.9% higher at $62.50.
And while the internal momentum indicators for Silver in both currencies are stretched, they are currently not in overbought territory. As such, we could see some high-level consolidation with an upward bias over the near term.
The Gold versus Silver ratio moved 1% higher in favor of Gold to close at 87.36. This means it takes 87.36 ounces of Silver to equal the price of one ounce of Gold.
The technical indicators suggest fading last week’s bounce as the broader trend is still pointing lower in favor of Silver.
Physical Platinum tagged a six-week high of $1445.00 on Wednesday before paring gains to close out the week 1.0% higher at $1380.00.
It is worth noting that last week’s price ranges held above the daily 30-day moving average during every session for the first time since July 20, which is a bullish indicator.
With the market’s focus on the relationship between softening US employment and the impact of the central bank’s response, we consider another aspect of the economy which could also benefit from interest rate relief.
As shown on Chart 2, interest payments by the federal government in the second quarter (Q2) on its monstrous debt rose by 1.6% from Q1, and by 3.2%, year-over-year to $283 billion.
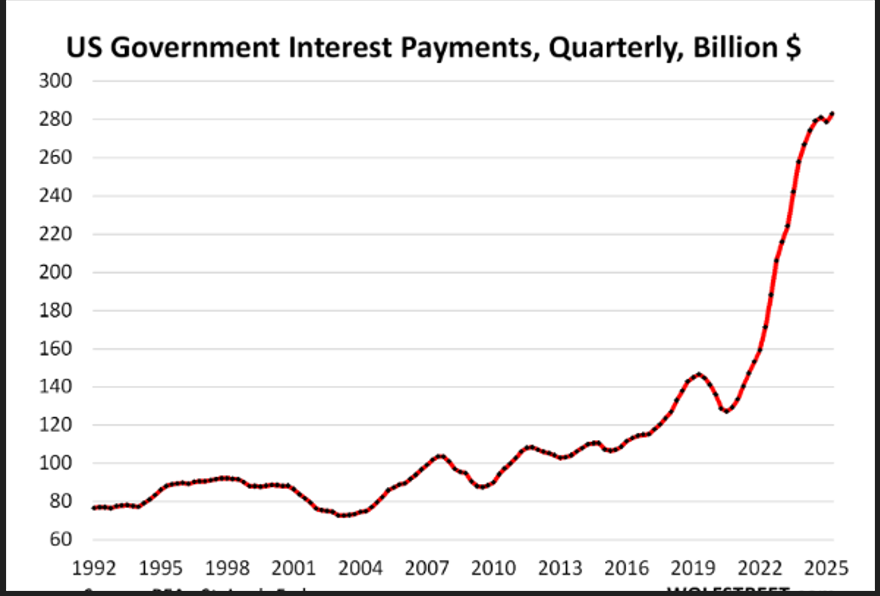
This pencils out to $1.1 trillion for the year, and it could have been worse.
The quasi-lull in the surge of interest payments this year is largely due to one factor: The freezing of the US debt ceiling.
The freezing of the debt ceiling kept the US Treasury debt at $36.2 trillion through the end of the Q2.
Since the debt ceiling was lifted in early July, the debt has already soared by over $1 trillion, and this added debt will increase the interest payments unless interest rates move materially lower.
Another troublesome spot in the US economy that could improve with lower rates is the Debt-to-GDP ratio.
As shown on Chart 3, the Debt-to-GDP ratio eased in Q2 to 120%, based on the second estimate of Q2 GDP, released by the Bureau of Economic Analysis last week.
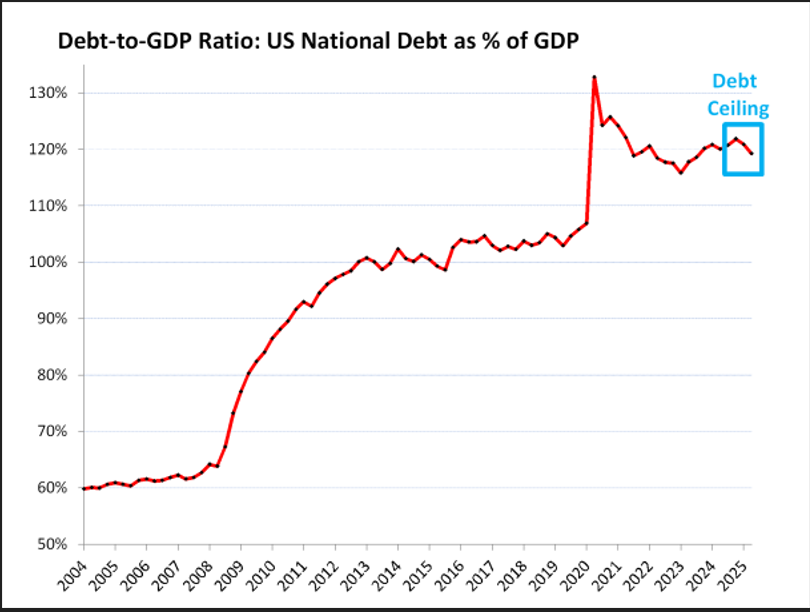
The ratio dipped for the second consecutive quarter because the debt ceiling temporarily blocked the debt from growing over the first six months of this year and kept debt at $36.2 trillion through Q2.
The debt has since then ballooned to $37.3 trillion, and it continues to balloon, and that will be reflected in an upward hook in Q3 Debt-to-GDP ratio.
The US government, by controlling its own currency, cannot default on debt issued in its own currency because it can always print itself out of trouble.
But in an inflationary environment, printing money to service an out-of-control debt and deficit could cause inflation to spiral higher, wreak havoc on the economy, lead to years of wealth destruction and lower standards of living.
Everyone from central bankers to Wall Street professionals to individual investors understands these risks, which is why Gold, Silver and Platinum prices have been outperforming all but a handful of paper assets over the last 18 months.
Gold, Silver and Platinum are not just a hedge against inflation. They represent the purest form of secure, long-term generational wealth assets.
Now is the time to consider reducing the concentration risk associated with paper assets and making physical hard assets the cornerstone of your wealth creation strategy.
Chart 4 Gold AUD
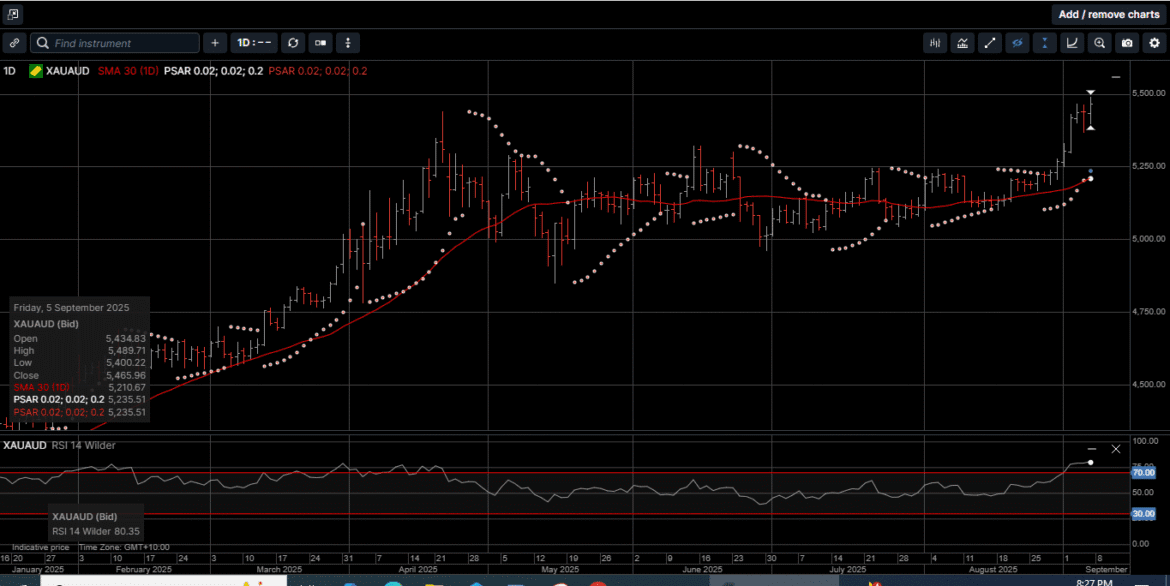
Chart 5 Silver AUD
This publication has been prepared for the GBA Group Companies. It is for education purposes only and should not be considered either general of personal advice. It does not consider any particular person’s investment objectives, financial situation or needs. Accordingly, no recommendation (expressed or implied) or other information contained in this report should be acted upon without the appropriateness of that information having regard to those factors. You should assess whether or not the information contained herein is appropriate to your individual financial circumstances and goals before making an investment decision, or seek the help the of a licensed financial adviser. Performance is historical, performance may vary, past performance is not necessarily indicative of future performance. Any prices, quotes or statistics included have been obtained from sources deemed to be reliable, but we do not guarantee their accuracy or completeness.