Due to the recent global unprecedented demand for physical precious metals, we wish to advise that that we are experiencing some backlogs in the dispatch department due to the sheer volume of transactions. We do appreciate your patience during this time – please be assured that everyone will receive their purchases as soon as is possible.
In addition, whilst our supply of most products remains strong, there are some high demand items that may experience delivery delays from time to time. This will be advised on the website within the product description.
Thank you for your patience and loyalty during this very exciting time.

The powerful, two-month rally in the precious metals complex ran into a wall of selling last week.
The high volatility selloff, after posting new all-time highs, highlighted a clear difference between short-term traders buying on margin and long-term investors who buy physical metals outright.
This week’s US FOMC policy statement will likely include 25 basis points of easing, and perhaps an end to the FED’s quantitative tightening (QT) operations, which could be bullish for Gold, Silver and Platinum prices.
Physical Gold priced in USD hit a new all-time high at $4381.00 on Monday before reversing 8.6% to post a low of $4004.00 early Wednesday. The yellow metal ended the week down 3.3% at $4111.00.
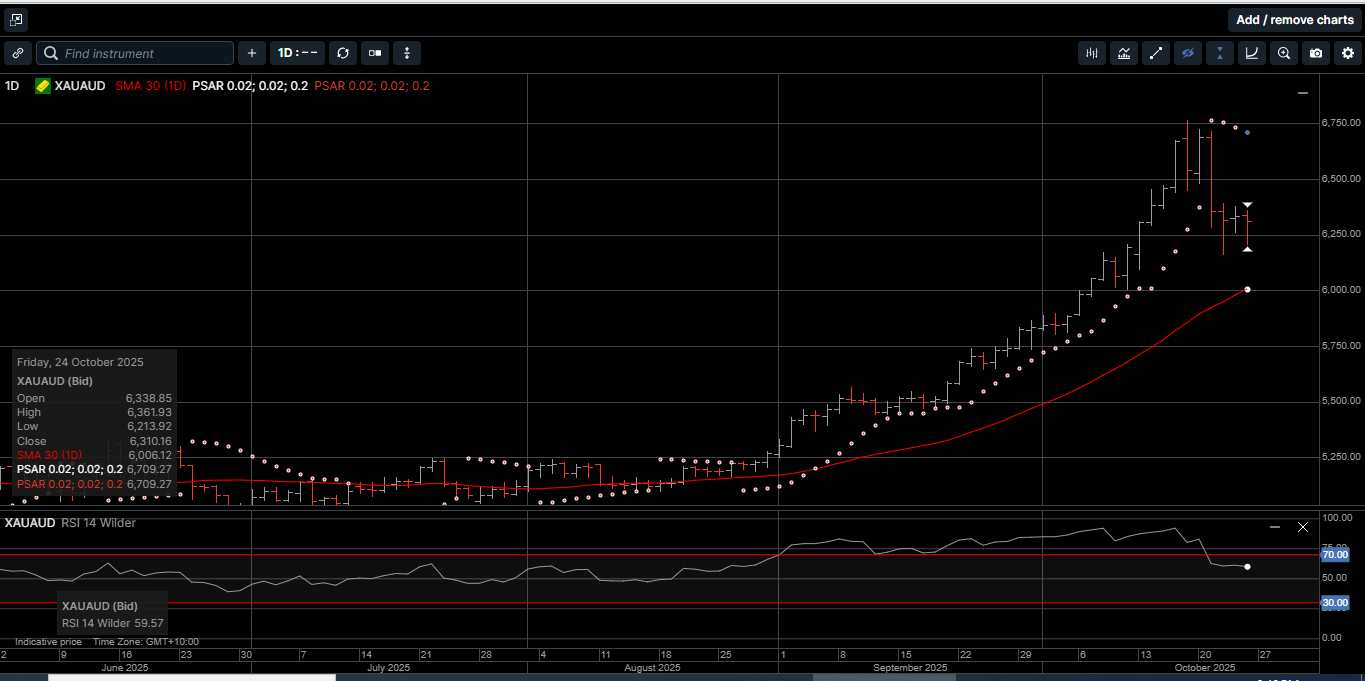
Gold denominated in AUD faced similar midweek selling pressure and finished the week with a 3.5% loss at $6310.
USD based physical Silver was down over 11% during Wednesday’s London session but recovered somewhat to close Friday’s NY session with a 6.1% loss at $48.60.
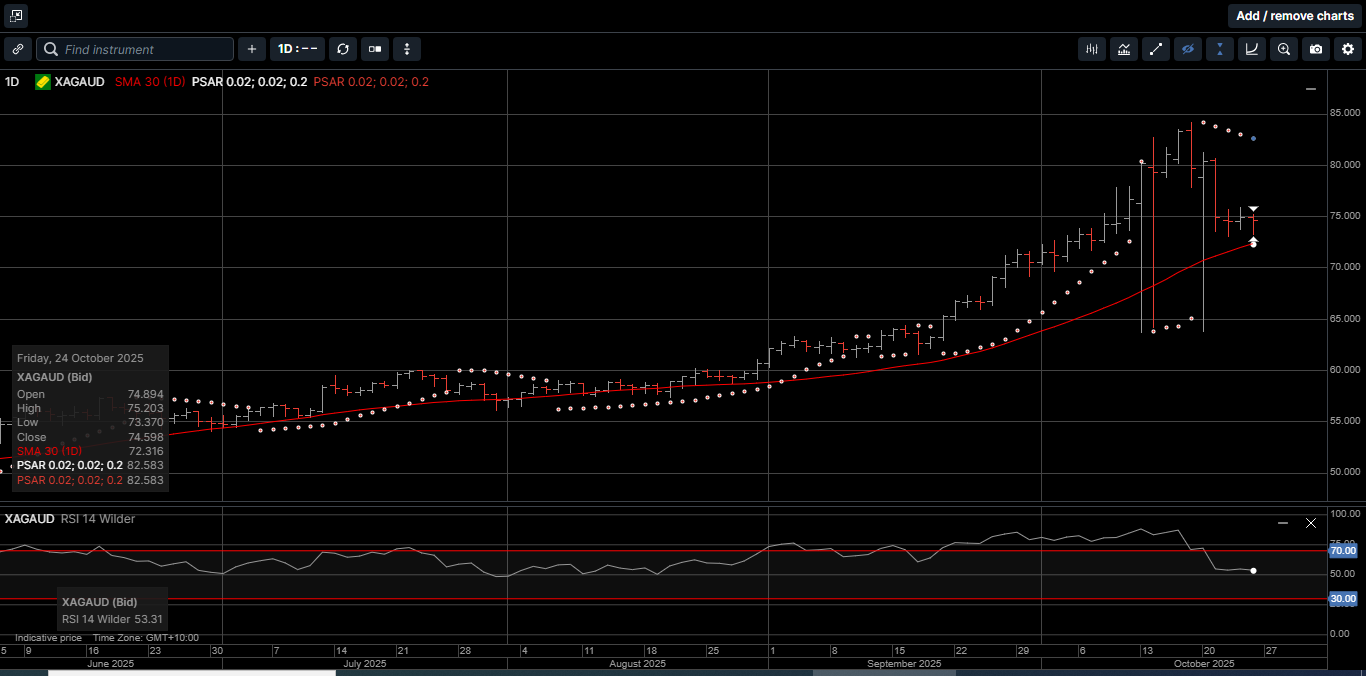
Silver denominated in AUD followed a similar price pattern and slipped 6.4% lower to close at $74.60.
The Gold versus Silver ratio rose 3.6% in favour of Gold to close at 84.50. This means it takes 84.50 ounces of Silver to equal the price of one ounce of Gold.
Physical Platinum traded in a 14% range for the week and dipped below $1500.00 for the first time in a month before finding support to finish the week with a 1.1% loss at $1604.00.
The precious metals complex was in overbought territory last week, so a reversion lower is not alarming and could be considered a technical correction as opposed to a change in trend.
Typically, initial price support within a bull market can be found in the area of the 30-day moving average on daily price charts.
The current 30-day moving average levels for the precious metals complex are: $3941.00 for USD Gold, $6006.00 for AUD Gold, $47.50 for USD Silver, $72.32 for AUD Silver, and $1558.00 for Platinum.
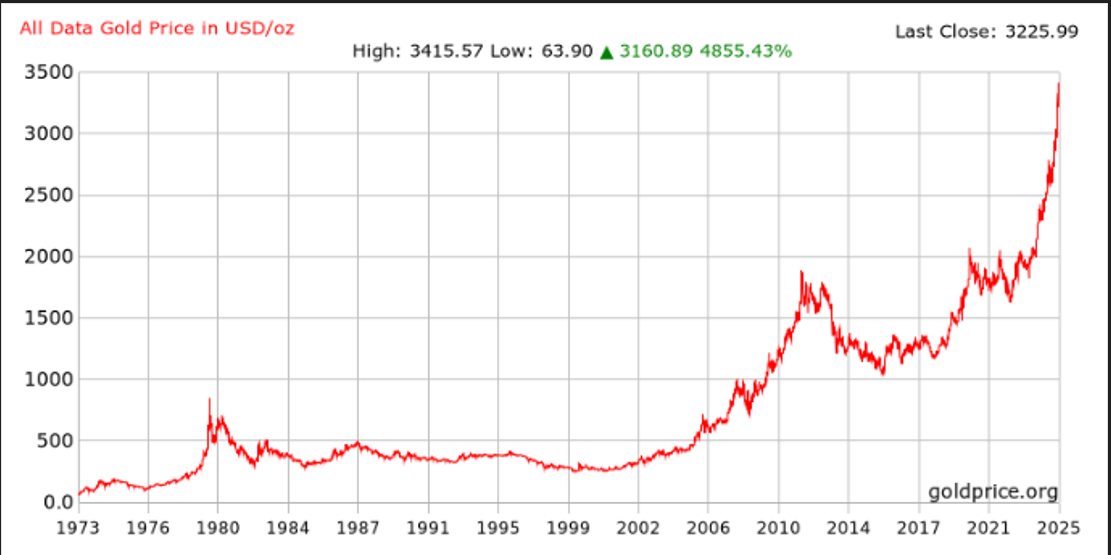
It’s often a temptation for chartists to dwell on the neatness of round numbers, especially in the physical Gold market.
But a more significant theme emerges when considering how quickly Gold has moved between the thresholds of the $1000.00 round numbers.
As illustrated on Chart 1, Gold first broke above the 1980 high of $850.00 per ounce and crossed $1,000 per ounce in March of 2008 during the global financial crisis.
Chart 1: Gold 50 year
Going forward, It would take more than 12 years, or 4400 days before Gold finally broke above the $2000.00 per ounce level in August of 2020.
The journey from $2000.00 to $3000.00 per ounce in March of this year took about five years, or around 1700 calendar days.
With those numbers in mind, it is the latest leap for the yellow metal that has been the most astonishing.
Physical Gold broke above $3,000.00 per ounce on March 18th and just crossed above $4,000.00 per ounce on October 8th. That pencils out to a span of about seven months or roughly 200 days.
This contraction in the time periods between new $1000.00 increments is significant: from 12 years, to five, to less than one.
This steady rise in the price of Gold could be either an accelerating loss of confidence in financial systems, or an extraordinary momentum cycle that could itself become self-reinforcing, or both.
The speed of these price leaps offers a broader narrative than just the psychological milestones alone.
In practical terms, as the timeframe between each new $1000.00 level in Gold continues to contract, we are likely witnessing a structural repricing of Gold’s role in the global financial system.
Quantifying the intervals provides an interesting hard asset framework: investors can map “days per new-thousand-dollar-ounces” against macro factors such as real yields, central bank reserves, or debt-to-GDP ratios.
For example, as shown on Chart 2, the recent rally has lifted the percentage of reserve assets held in Gold to an impressive 30% from 25% just 12 months ago.
Chart 2: 30% reserve asset
Gold at $4,300 per ounce, Silver at $50.00 per ounce and Platinum above $1700.00 are more than just spectacular market headlines.
These hard asset price levels are the sum of overlapping uncertainties: inflation, currency instability, debt, central bank policy, and geopolitical turbulence.
The shrinking intervals between each successive $1,000 price gain in Gold reflects a financial environment that is changing faster than ever before.
An environment where safe haven assets like Gold, Silver and Platinum are sought not gradually, but urgently.
With last week’s selloff removing some of the technically overbought conditions in the precious metals, now is the time to consider how hard assets represent time proven value and increase wealth security within a diversified, long-term strategy.
Chart 3: Gold AUD
Chart 3: Gold AUD
Chart 4: Silver AUD
Chart 4: Silver AUD


This publication has been prepared for the GBA Group Companies. It is for education purposes only and should not be considered either general of personal advice. It does not consider any particular person’s investment objectives, financial situation or needs. Accordingly, no recommendation (expressed or implied) or other information contained in this report should be acted upon without the appropriateness of that information having regard to those factors. You should assess whether or not the information contained herein is appropriate to your individual financial circumstances and goals before making an investment decision, or seek the help the of a licensed financial adviser. Performance is historical, performance may vary, past performance is not necessarily indicative of future performance. Any prices, quotes or statistics included have been obtained from sources deemed to be reliable, but we do not guarantee their accuracy or completeness.

If you would like to stay informed about up to the minute pricing, market news and specials, subscribe here.

Live Prices

Gold

Silver

Gold

6,148.23/oz

Silver

72.40/oz

Platinum

2,431.65/oz

Gold

6,148.23

Silver

72.40

Platinum

2,431.65

Latest Post

Gold and Silver Slip Lower in Front of This Week’s FOMC Meeting

Gold, Silver and the F.O.M.O. Trade

X
6,148.23
72.40