Gold and Silver Slide Lower on “Risk Off” Sentiment
by Joel Cameron
Posted on 9 Mar, 2026 in
Global financial markets were rattled last week as military activity in the Middle East continues escalate throughout the region.
Prices in the energy sector surged on the news that shipping lanes around the Persian Gulf were interrupted and not safe for navigation.
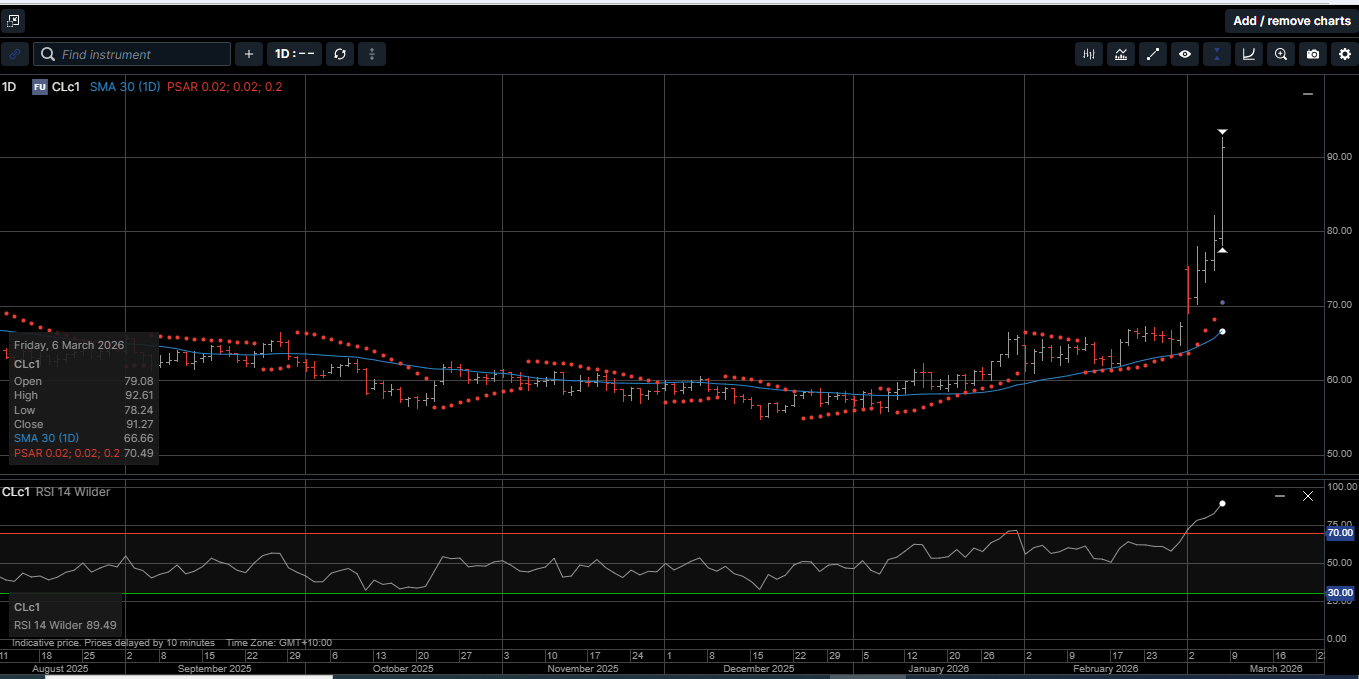
As illustrated on Chart 1, the price of West Texas Intermediate (WTI) Crude Oil increased by over 35% last week.
This was the strongest one-week rally in WTI in more than 40 years and was largely mirrored by price spikes in both Brent Crude Oil and Natural Gas.
The prospects of sharply higher energy costs triggered “Risk Off” sentiment across capital markets, which pushed stock indexes lower and the USD higher.
The stronger USD combined with margin selling to support falling stock prices weighed down the precious metals complex.
Physical Gold priced in USD slipped 2.0% lower to finish the week at $5170.00.
This was the first down week in the last six, but the yellow metal still held above its 30-Day Moving Average (30-DMA) at $5068.00 to maintain its positive long-term technical slope.
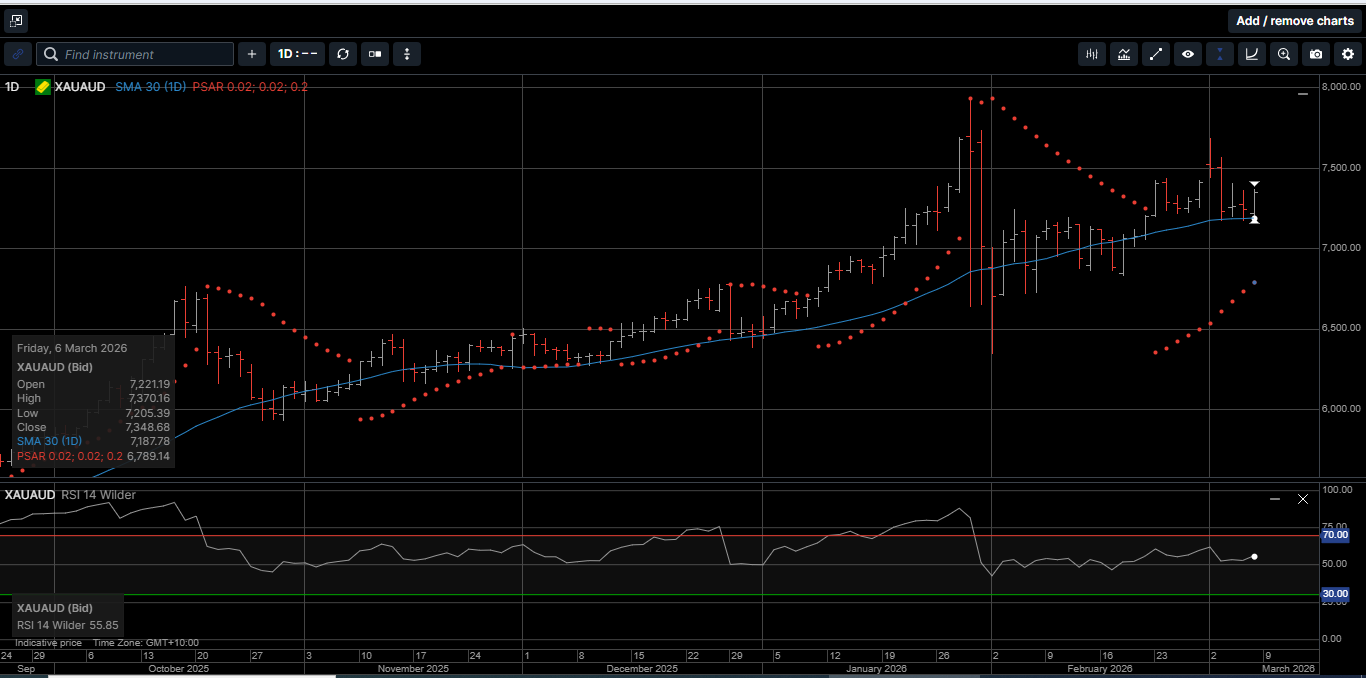
Gold denominated in AUD lost 1.1% to close at $7348.00. The 1.2% drop in the AUD/USD tempered losses for AUD Gold, which held above its 30-DMA at $7187.00.
Physical Silver priced in USD was down over 17% early in the week but found a bid on the weaker-than-expected US Payroll report last Friday to finish the week down 10.2% at 84.40.
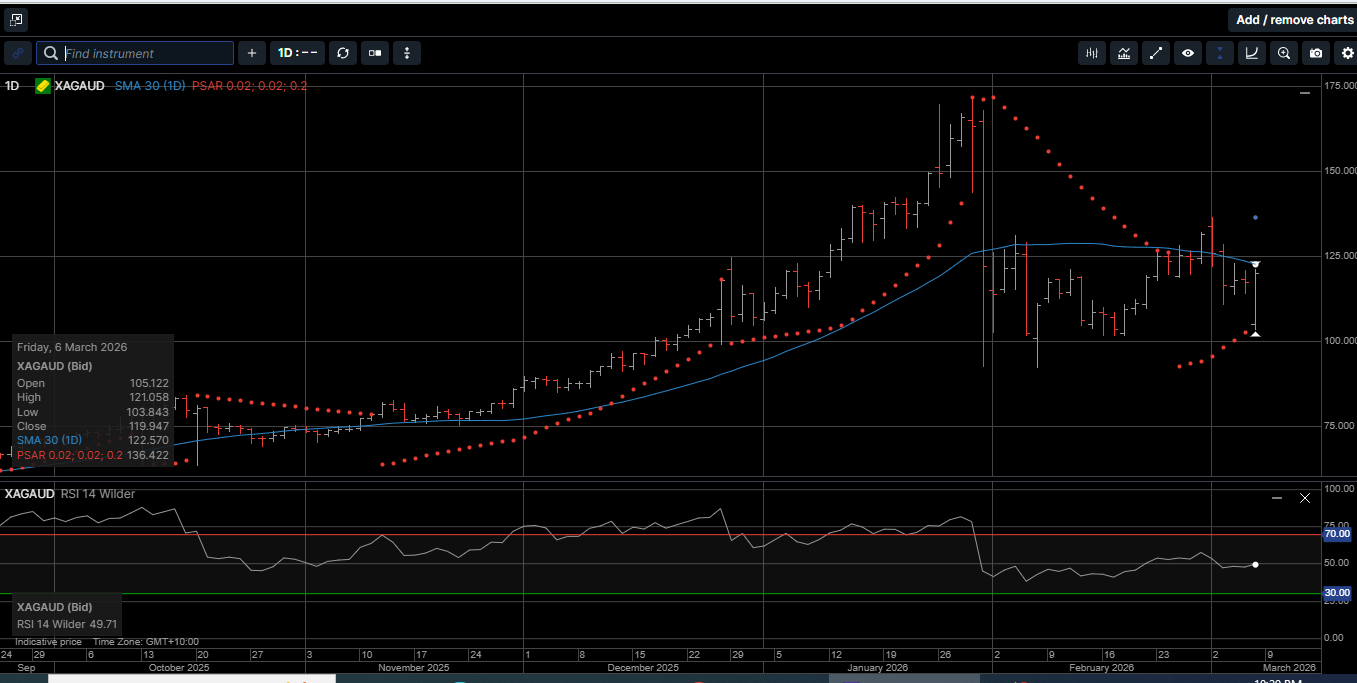
Silver denominated in AUD traded 8.7% lower and closed out the week at $119.95.
Silver in both currencies traded on both sides of their 30-DMAs, which suggests upside momentum is in the process of rebuilding. That said, the February low prices look safe for now.
The Gold versus Silver ratio rose 4.95% to 60.90 in favor of Gold. That means it takes 60.90 ounces of Silver to equal the price of one ounce of Gold.
Physical Platinum was 15.00% lower on Tuesday but firmed in the second half of the week to close with a weekly loss of 9.5% at $2143.00.
The support range between $2000.00 and $1980.00 looks like a durable low area.
In the early stages of a “Risk Off” market condition, it’s not unusual to see the precious metals trade lower along with equity markets.
One of the reasons for this correlation is that global equity markets can be highly leveraged with many investors trading on margin.
When individual leveraged stocks go down sharply, investors tend to liquidate profitable positions in Gold, Silver and Platinum to cover the margin calls.
This is a temporary dynamic as a protracted repricing of stock indexes draws investors into the safe haven of the precious metals.
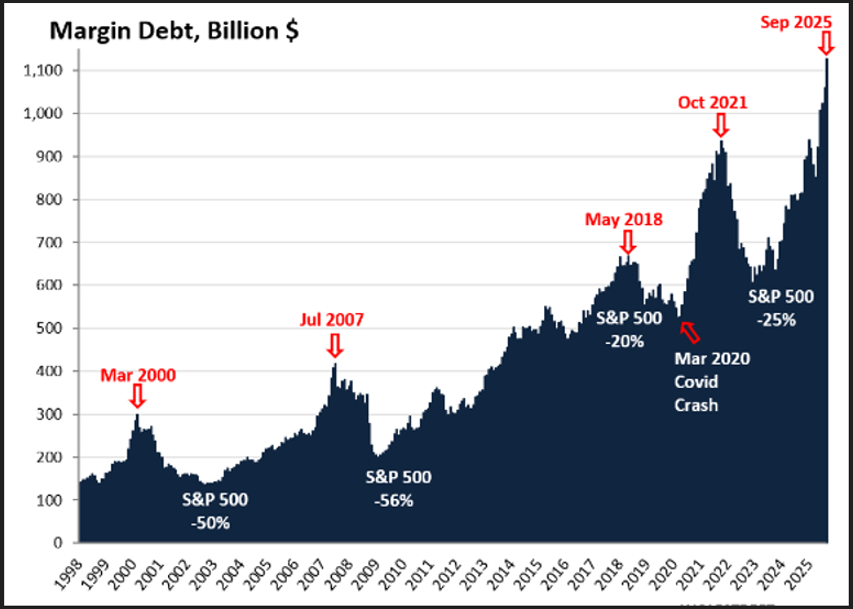
As shown on Chart 2, as of September of last year, the SP 500 was trading with its highest percentage of margin debt on record at over $1.1 trillion.
As such, even if the conflict in the Middle East is resolved over the next several weeks, the major stock indexes still look vulnerable to a material correction lower.
Additionally, evidence is beginning to reflect another round of expansion of the FED’s balance sheet, which is supportive of Gold, Silver and Platinum prices.
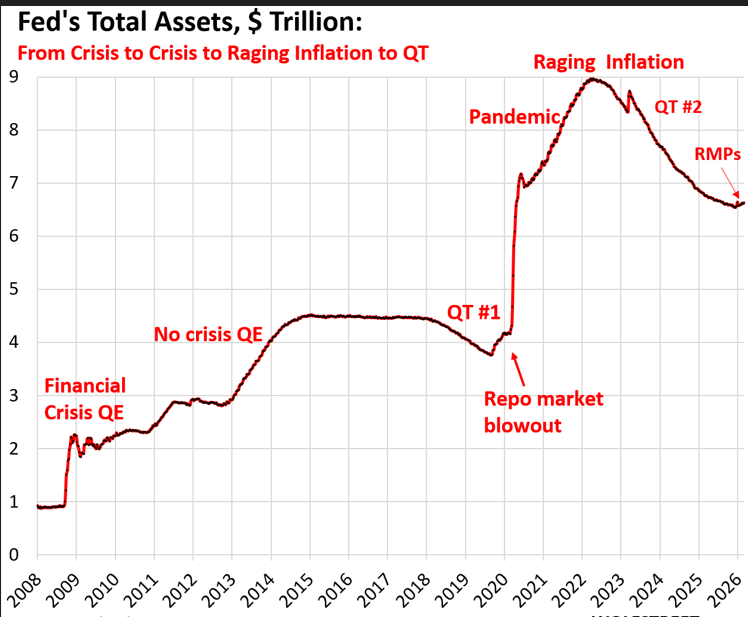
As illustrated on Chart 3, total assets on the FED’s weekly balance sheet rose by $23 billion in February, to $6.63 trillion.
In fact, since the beginning of the “Reserve Management Purchases” (RMPs) in early December, total assets have risen by $93 billion.
Let’s take a look back to see how this FED balance sheet action has developed.
The $2.4 trillion in Quantitative Tightening (QT) ended in November.
At the December FOMC meeting, the FED announced it would let the balance sheet grow by buying roughly $40 billion per month in T-bills until mid-April.
The FED is also replacing its 10-year Mortgage Backed Securities (MBS) that run off the balance sheet with T-bills (Treasury securities with terms of 1 year or less).
By replacing MBS with T-bills, the Fed is replacing long-term securities with short-term securities, which by many metrics could be the catalyst of the next significant rally in Gold, Silver and Platinum.
This ample reserve strategy from the FED was in place before the conflict in the Middle East commenced and is designed to keep interest rates on the low side to reduce the pressure of servicing the US deficit.
That said, we can’t find any examples in the history of mankind when a kinetic war has improved the budget deficits of the combatants.
In short, long-term investors should overlook the intraday volatility, and don’t let short-term price action shake you out of physical positions that real money institutions are trying to build.
Hard assets represent real money and increase individual wealth security.
Now is the time to consider using the current pullback in prices as an opportunity to increase your physical holdings of Gold, Silver, and Platinum.
This publication has been prepared for the GBA Group Companies. It is for education purposes only and should not be considered either general of personal advice. It does not consider any particular person’s investment objectives, financial situation, or needs. Accordingly, no recommendation (expressed or implied) or other information contained in this report should be acted upon without the appropriateness of that information having regard to those factors. You should assess whether or not the information contained herein is appropriate to your individual financial circumstances and goals before making an investment decision or seek the help the of a licensed financial adviser. Performance is historical; performance may vary; past performance is not necessarily indicative of future performance. Any prices, quotes or statistics included have been obtained from sources deemed to be reliable, but we do not guarantee their accuracy or completeness.