US interest rate expectations continue to be a key driver for the precious metals complex.
Last week’s softer than expected US inflation data lifted the metals as rate hike expectations slid lower.
The drop in energy prices last month was largely responsible for the fall in both consumer and producer price inflation reported last week.
However, Crude Oil prices have risen over the last 10 days as military activity in the Persian Gulf escalated and expanded to other Gulf states.
Without a clear near-term off ramp to the kinetic conflict in the region, Gold, Silver and Platinum prices could remain in the accumulation ranges over the next few weeks.
Physical Gold priced in USD traded in a relatively narrow $145.00 range for the week. The yellow metal slipped 2.45% lower to close at $4017.00.
The Relative Strength Index (RSI) is neutral at 41.00, and the 30-Day Moving Average (30-DMA) looks reachable at $4127.00; initial support is $3950.00.
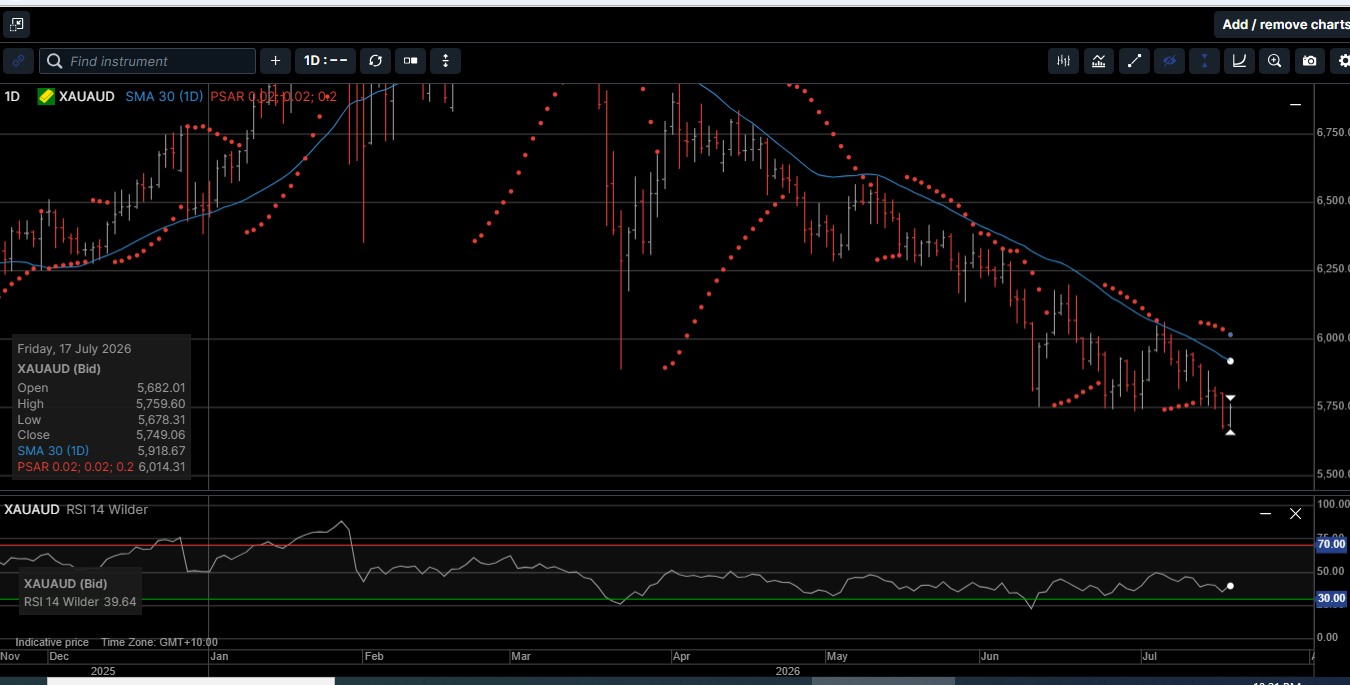
Gold denominated in AUD Fell to a 10-month low at $5675.00 and closed the week 2.9% lower at $5750.00. The RSI reading at 40.00 is neutral. The 30-DMA is $5918.00, and initial support is in the $5650.00/$5660.00 range.
Physical Silver priced in USD slipped to an eight-month low at $54.76 and closed out the week 6.5% lower at $55.95. The RSI is approaching oversold territory at 35.00. The 30-DMA is $61.90, and initial support is near the $54.20 level.
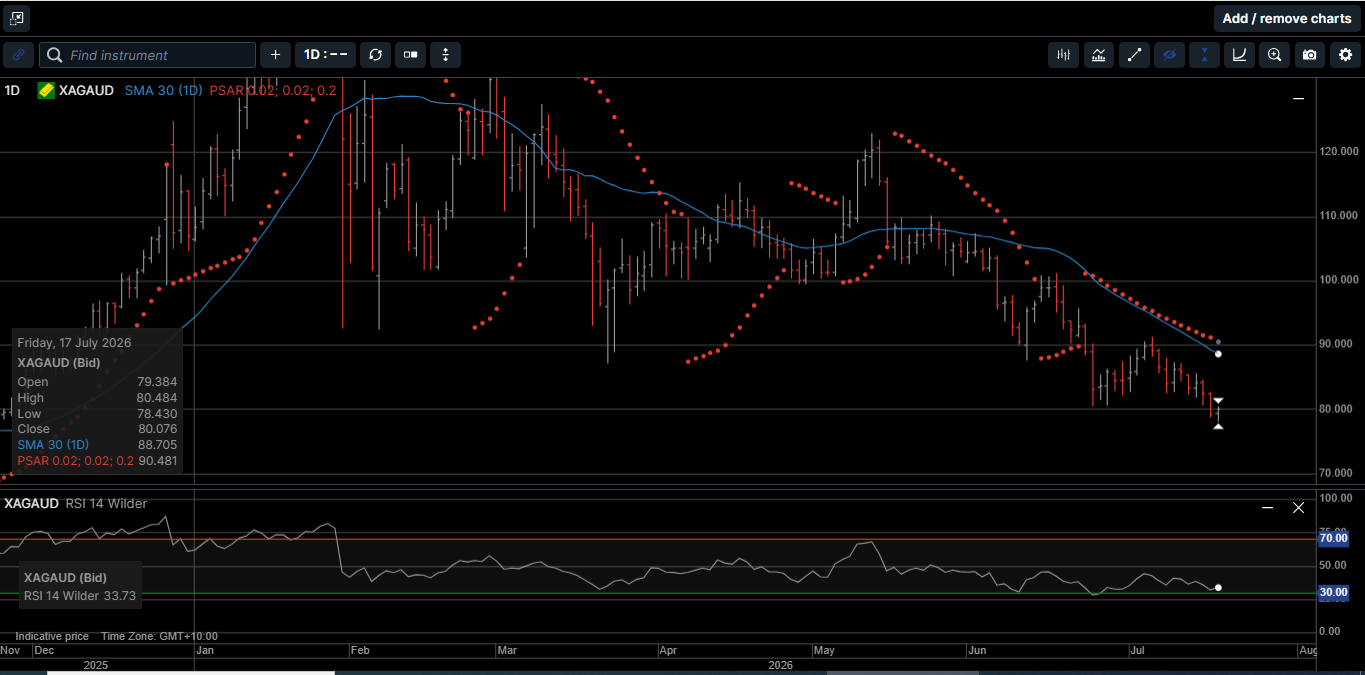
Silver denominated in AUD hit an eight-month low at $78.40 and finished the week 6.8% lower at $80.10. The RSI is oversold at 33.00; the 30-DMA is $88.70, and initial support is near the $78.00 area.
The Gold versus Silver ratio rose 4.3% in favor of Gold to close at 71.70. That means it takes 71.70 ounces of Silver to equal the price of one ounce of Gold.
The ratio hit a five-month high at 72.50 and now looks to be overextended on the long side and ready to revert lower into the 69.00 handle.
Physical Platinum reached a one-month high at $1695.00 last Wednesday before reversing lower to close out the week 4.3% lower at $1560.00.
It’s important to note that Wednesday’s close at $1675.00 was the first close above the 30-DMA since May 14th, and the RSI has turned higher at 41.80, which is a bullish momentum signal.
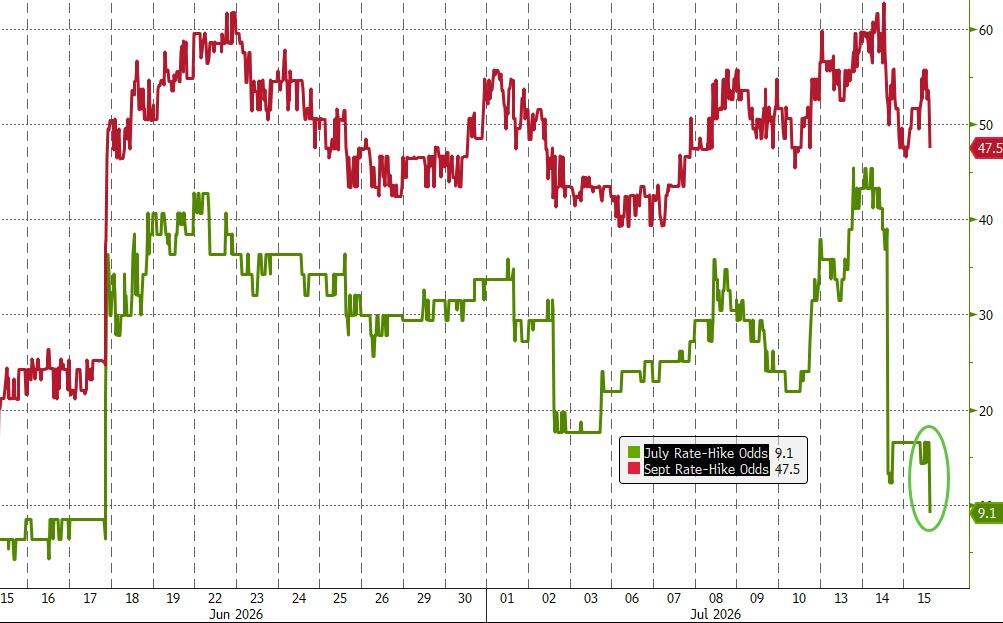
Chart 1 rate hike odds
As illustrated on Chart 1, the odds of a FED rate hike this month fell from 45% to just under 10% after both the consumer and producer inflation numbers printed lower.
The Treasury department welcomed the lower inflation aggregates since they are in charge of financing the administration’s spending.
Along those lines, during the week of July 6th, the US government sold a whopping $743 billion of Treasury securities over the course of 10 separate auctions.
Of those operations, $612 billion were Treasury bills, spread over seven massive auctions, with maturities from 4 weeks to 52 weeks, most of them to replace maturing T-bills.
In the longer tenors, $131 billion were 3-year and 10-year Treasury notes and 30-year Treasury bonds, which replaced $61 billion of maturing securities, causing the total amount of notes and bonds outstanding to balloon by $70 billion.
There was strong demand at the auctions, but at higher yields.
T-bill yields have begun to factor in the possibility of FED Funds rates above the 3.50% target later in the year.
The 6-month T-bills sold at an investment rate of 3.96%. The 1-year T-bills sold at an investment rate of 4.03%, for the first time over 4% since the auction on July 8, 2025, and that was three FED rate-cuts ago.
The 10-year Treasury notes at a yield of 4.58%, highest auction yield since February 2025.
And most concerning, 30-year Treasury bond sold at a yield of 5.058%, the highest auction yield since 2007.
Up until last week’s report, US consumer Inflation had been running at a rate of over 4.00, so all those T-bill yields are below the rate of inflation, and “real” (after inflation) returns are negative.
But here is the current interest rate conundrum: Treasury yields of 1 year and shorter are not impacted by inflation, but by the FED’s policy rates and by market expectations of those policy rates within the remaining maturity window of those yields.
And the Treasury market is now solidly leaning in the direction of rate hikes, starting with at least one hike this year.
So, if the new FED Chief, Kevin Warsh wants to talk the Treasury market down from those rate-hike expectations and keep investors buying US debt, he needs to get busy bringing real yields back to the FED Funds rate.
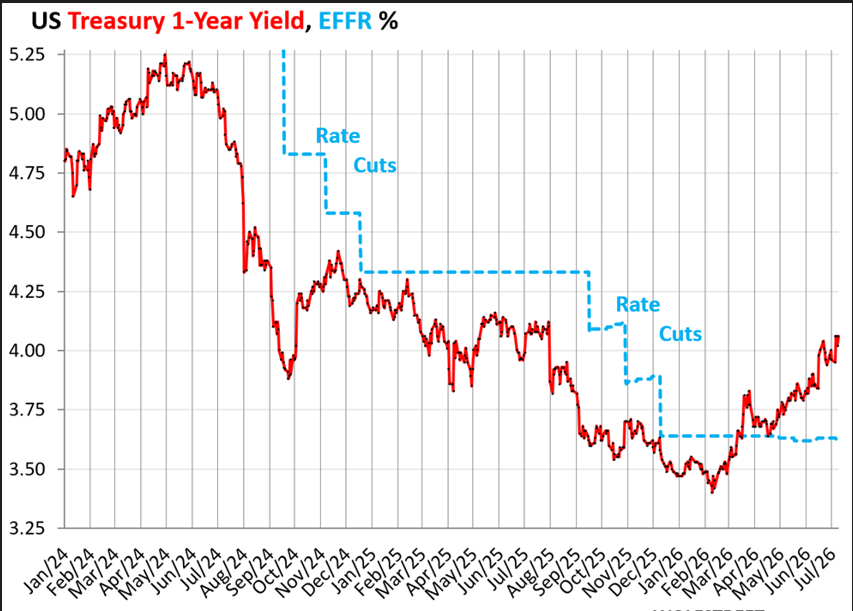
Chart 2 1 year treasury yield
For example, as shown on Chart 2, the 1-year yield in the secondary market is now 44 basis points above the Effective FED Funds Rate (EFFR, blue), which the Fed targets with its policy rates, indicating that the Treasury market is solidly in the camp of a rate-hike cycle.
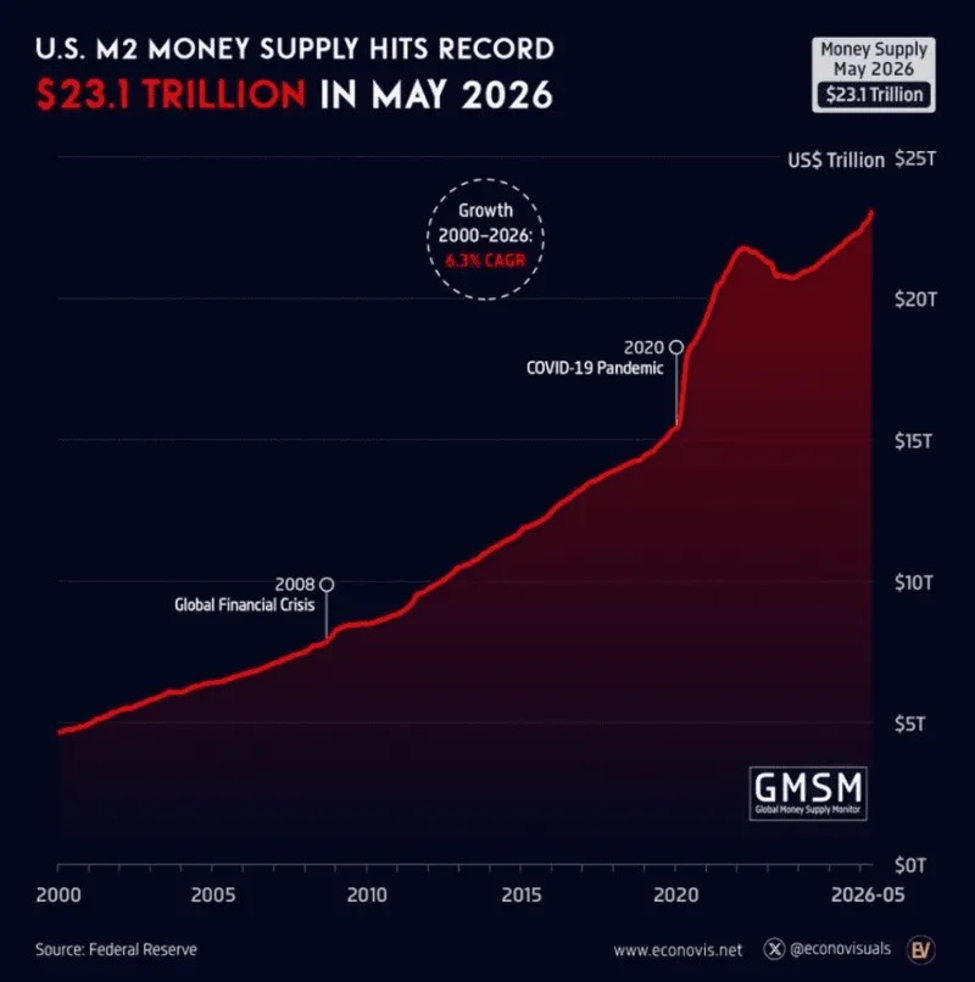
Chart 3 US M2 money supply
This is a big problem for the Treasury department, especially, as shown on Chart 3, with the M2 money supply hitting all-time highs last month.
It’s reasonable to believe that the FED will “look through” the recent inflation levels and keep rates at the current, or lower, trajectory so that the government can remain funded without risking a systemic crisis in the bond market.
This policy mix will not be USD friendly and could pressure the greenback lower, which is bullish for Gold, Silver and Platinum.
In short, paper currencies are subject to changes in monetary policy. All central banks can expand their money supply, and historically, most have.
But the US has just reached another dubious economic milestone with the broad M2 money supply reaching a new all-time high, which means each USD buys less over time.
Conversely, supply of precious metals is constrained by geology, industrial demand and the cost of mining; they cannot be expanded by policy decision.
Governments and central banks can print money. They cannot print physical Gold, Silver or Platinum.
As such, now is the time to consider scaling out of risky paper assets and adding secure hard assets to your long-term, diversified wealth creation strategy.
Chart 4 Gold AUD
Chart 5 Silver AUD
This publication has been prepared for the GBA Group Companies. It is for education purposes only and should not be considered either general of personal advice. It does not consider any particular person’s investment objectives, financial situation, or needs. Accordingly, no recommendation (expressed or implied) or other information contained in this report should be acted upon without the appropriateness of that information having regard to those factors. You should assess whether or not the information contained herein is appropriate to your individual financial circumstances and goals before making an investment decision or seek the help the of a licensed financial adviser. Performance is historical; performance may vary; past performance is not necessarily indicative of future performance. Any prices, quotes or statistics included have been obtained from sources deemed to be reliable, but we do not guarantee their accuracy or completeness.
Share This Article
If you would like to stay informed about up to the minute pricing, market news and specials, subscribe here.