Gold and Silver Rally; Platinum Soars
Gold and Silver Rally; Platinum Soars
As September draws to a close, the daily charts for the precious metals complex reflect one of the strongest monthly rallies on record.
Central banks trimming rates across developed economies combined with growing investment inflows suggests upside momentum in physical Gold, Silver and Platinum can continue.
Gold priced in USD raced to a new all-time high at $3790.00 on Tuesday before consolidating gains to finish the week 2.0% higher at $3759.00.
Gold denominated in AUD also posted a new all-time high at $5787.00 and finished the week with a 2.8% gain as well as a new all-time high closing price at $5740.00.
Since the US FED pivoted to an interest rate easing cycle on August 23rd, Gold in USD and AUD have rallied by 11.5% and 10.6%, respectively.
Silver priced in USD tagged $46.62 on Friday, which is the highest price since May, 2011. Silver finished the week up 6.9% to close at $46.04.
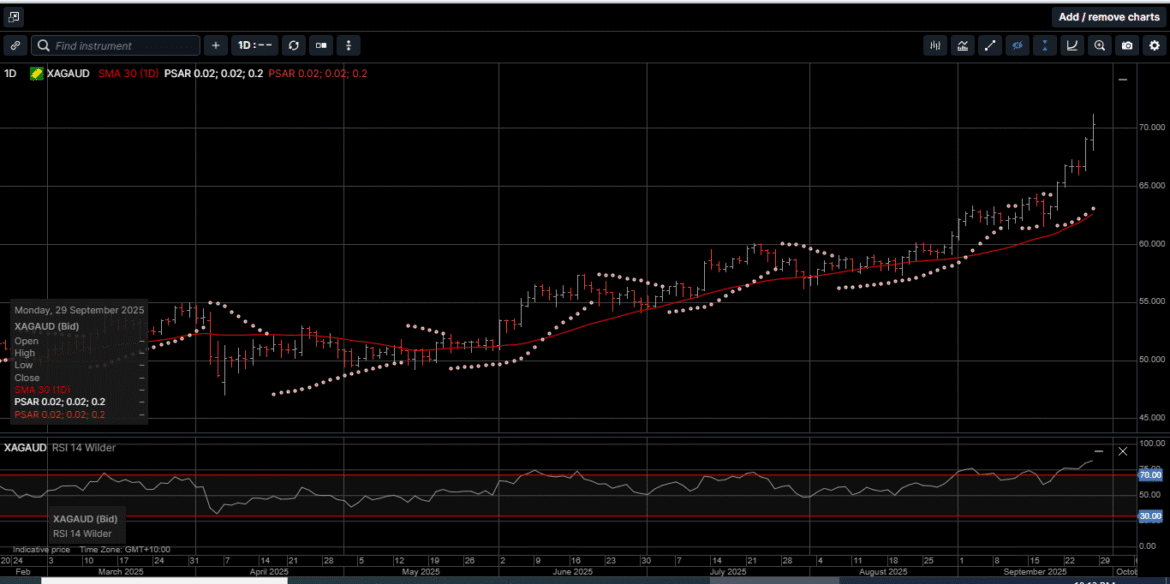
Silver based in AUD hit a new all-time high at $71.19 before slipping lower into the weekend to close 7.7% higher at $70.29, which is a new all-time high closing price.
Since August 23rd, Silver in USD and AUD have returned 18.4% and 17.6%, respectively.
The Gold versus Silver ratio posted a new 52-week low last week at 81.55 in favor of Silver. This means it takes 81.55 ounces of Silver to equal the price of one ounce of Gold.
The ratio hit 107.10 on April 22nd, since then, Silver has outperformed Gold by 23.8%.
The price of physical Platinum surged to $1585.00 last week, which was the highest price since April 2013 and closed a whopping 12.7% higher for the week at $1580.00.
Over the last month, Platinum has picked up 16.6% and has now returned an impressive 71% on a year-to-date basis.
As illustrated on Charts 1 and 2, Platinum is now in its third consecutive year of a steep supply/demand imbalance.
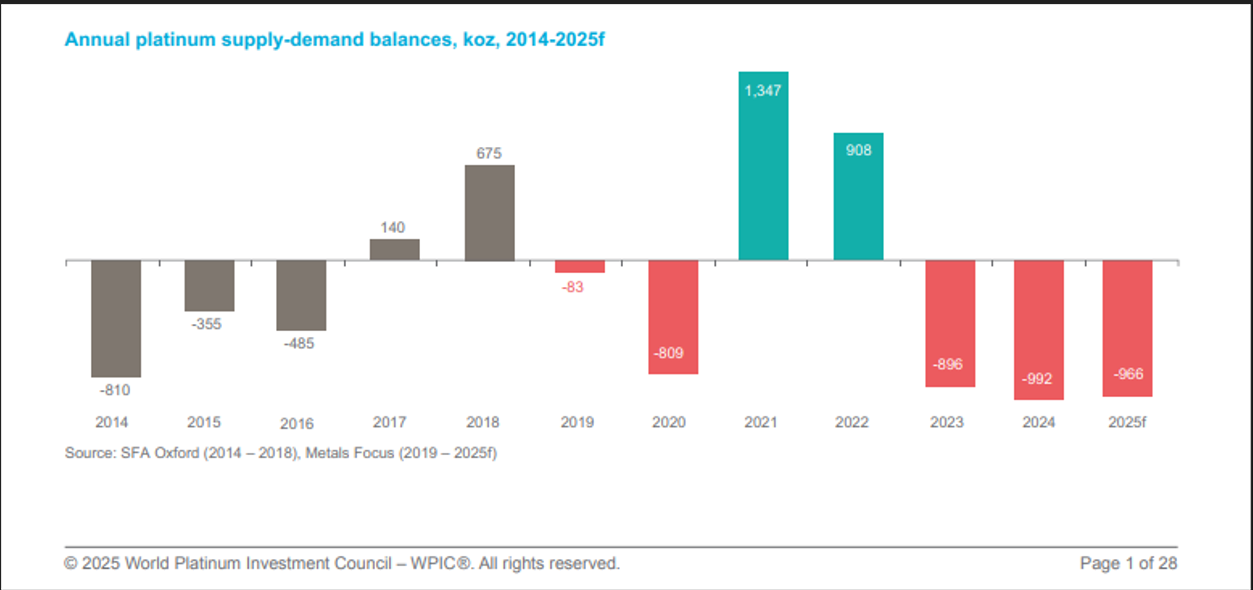
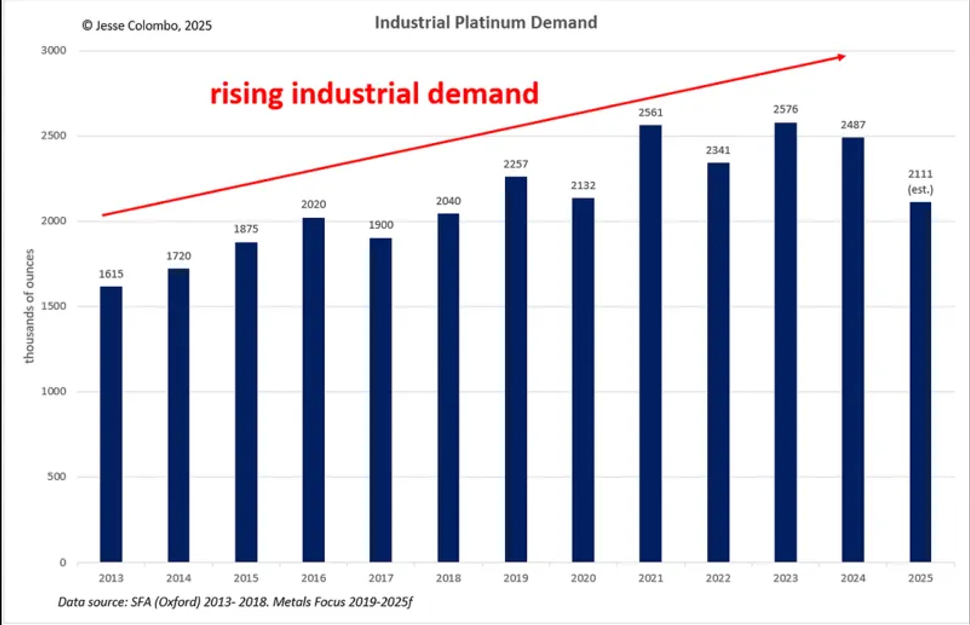
And while the industrial usage has remained relatively unchanged over the last five years, the sharp gains in Platinum demand stem from a 300% rise in investment coins and bars, which has jumped to 461,000 ounces in 2025’s first quarter from 113,000 ounces recorded in the first quarter of 2024.
Gold recently achieved a historic milestone by surpassing its inflation-adjusted all-time high when it broke over $3,500.00 per ounce.
This surge highlights Gold’s enduring role as a store of value amid inflationary pressures and shifting market dynamics.
While nominal prices captured the headlines, the inflation-adjusted milestone represents a paradigm shift.
As shown on Chart 3, In January 1980, Gold’s $850 peak equated to $3,486 in 2025 dollars using the Consumer Price Index (CPI) rate of 4.10%.
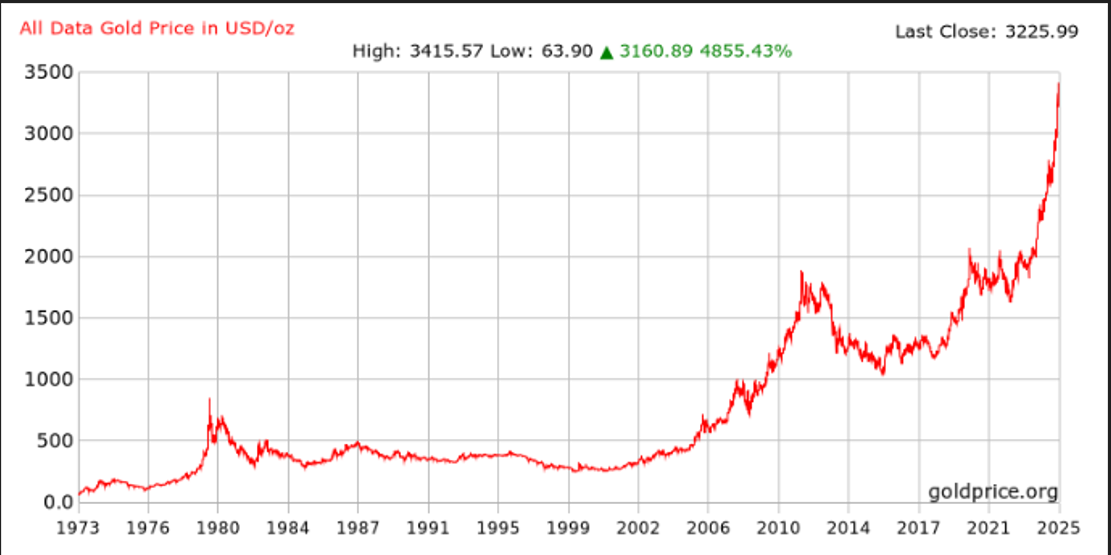
The recent breach of this threshold marks the first time the yellow metal has exceeded its purchasing power peak from the 1980s inflation era.
This development challenges conventional valuation models and suggests structural changes in global reserve asset preferences, especially for central banks.
The inflation-adjusted record is particularly significant as it represents Gold reaching its highest real value in over four decades, demonstrating the metal’s enduring role as a store of wealth despite numerous economic cycles and monetary policy shifts.
Silver priced in USD hit an all-time high of $50.00 in January of 1980. Using the same equation, the inflation adjusted high would be $205.00.
The all-time high in Platinum was $2290.00 posted in March of 2008. The adjusted CPI between 2008 and 2025 is 2.42%, which means the inflation adjusted all-time high in Platinum pencils out to $3435.00.
Gold, Silver and Platinum have historically served as a reliable store of value during periods of currency devaluation and economic uncertainty.
As purchasing power of fiat currencies declines, these hard assets typically increase in value, making them an effective inflation hedge which increases individual wealth security.
Gold’s breach of its inflation-adjusted high signals a new era for monetary metals, blending ancient store-of-value characteristics with modern macroeconomics.
Now is the time to consider adding to your physical Gold, Silver and Platinum holdings as cornerstone assets in your long-term wealth creation strategy.
Chart 4 Gold AUD
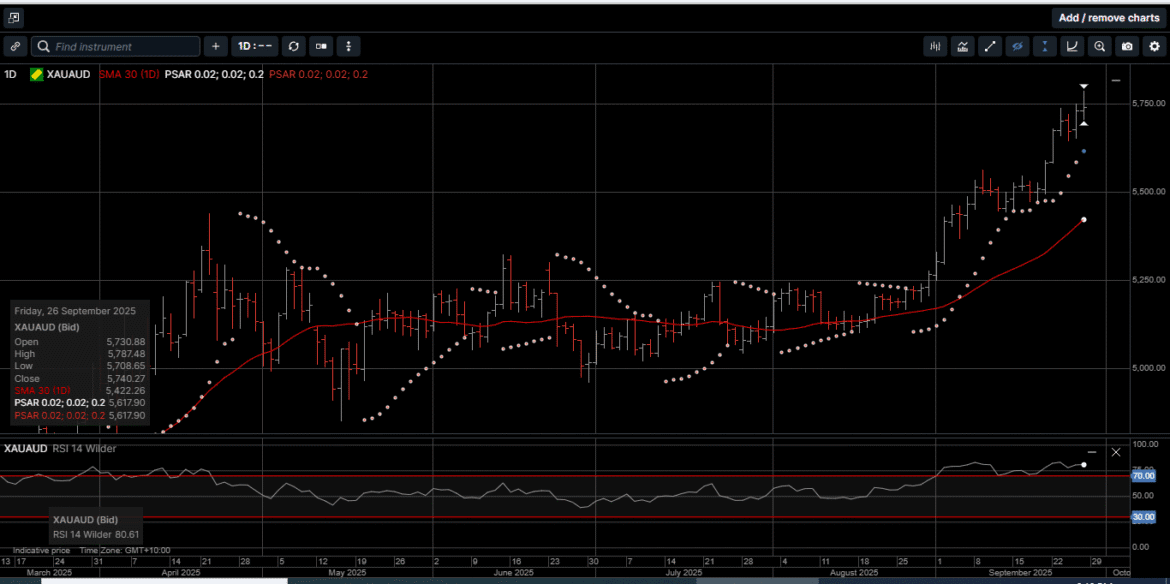
Chart 5 Silver AUD
This publication has been prepared for the GBA Group Companies. It is for education purposes only and should not be considered either general of personal advice. It does not consider any particular person’s investment objectives, financial situation or needs. Accordingly, no recommendation (expressed or implied) or other information contained in this report should be acted upon without the appropriateness of that information having regard to those factors. You should assess whether or not the information contained herein is appropriate to your individual financial circumstances and goals before making an investment decision, or seek the help the of a licensed financial adviser. Performance is historical, performance may vary, past performance is not necessarily indicative of future performance. Any prices, quotes or statistics included have been obtained from sources deemed to be reliable, but we do not guarantee their accuracy or completeness.