Gold and Silver Rally On Middle East Ceasefire
The news of a two-week ceasefire between the US and Iran last Wednesday sparked a strong rally across the precious metals complex.
The hopes of an end to the hostilities in the Persian Gulf prompted a sharp drop in US interest rates, which pushed the USD lower and provided a tailwind for last week’s positive trade in the metals.
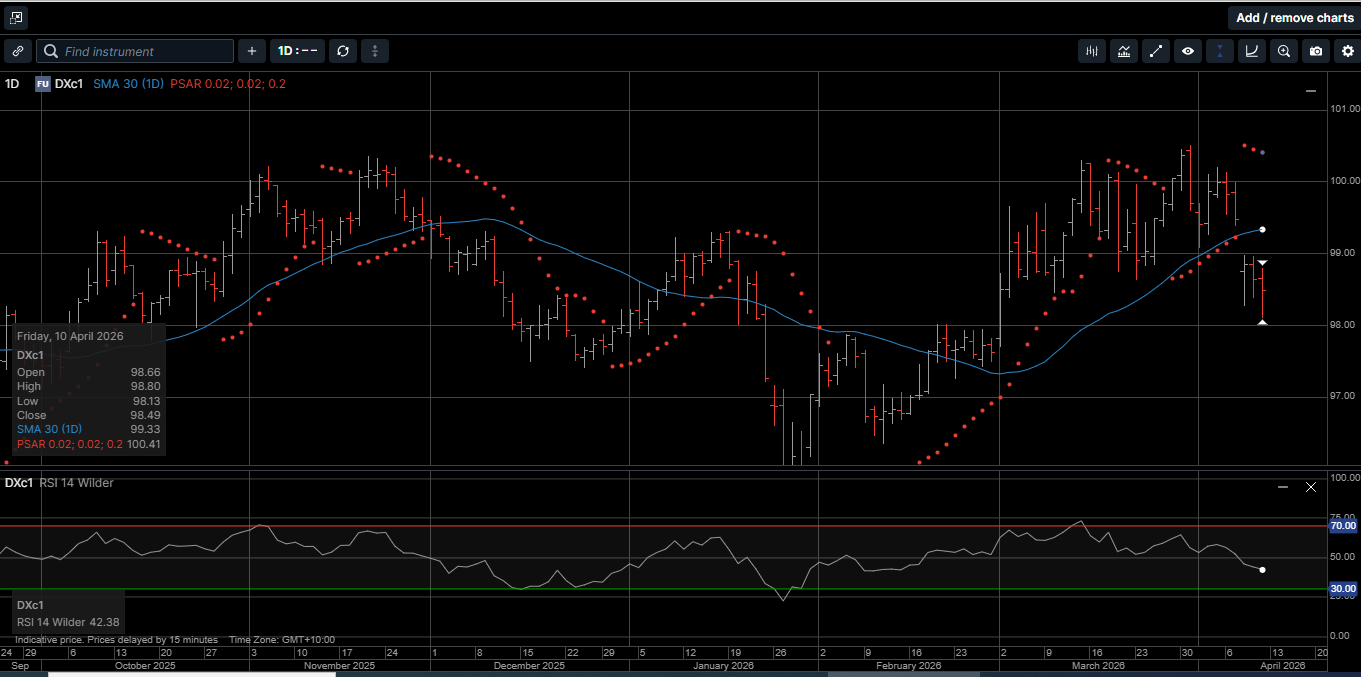
As illustrated on Chart 1, the USD fell against all G-10 currencies last week. This has broken key support for the USD Index and is bullish for hard assets.
From a technical perspective, Gold, Silver and Platinum have now reached previous breakout levels on the daily price charts, which suggests increasing upside momentum going forward.
Physical Gold priced in USD hit a one-month high at $4858.00 before slipping lower to finish the week 1.8% higher at $4750.00.
The 30-Day Moving Average (30-DMA) is now at $4837.00. A daily close above this level would suggest the $4098.00 level hit on March 23rd is a durable low.
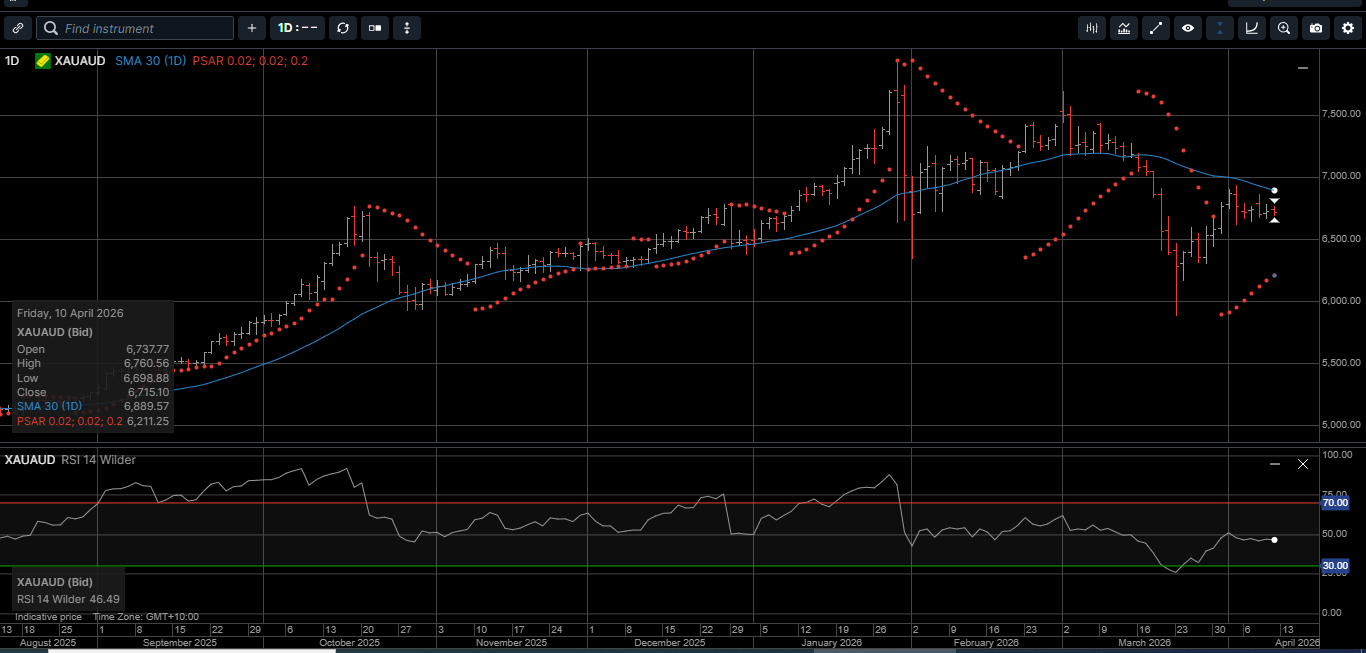
Gold denominated in AUD tagged a three-week high of $6930.00 and then reverted lower to close out the week fractionally lower $6765.00.
The 2.4% rally in the AUD/USD weighed on the AUD Gold. The 30-DMA is now at $6890.00 and looks to be within reach.
Physical Silver priced in USD traded higher every day last week and reached a one-month high at $77.63 before sliding lower to close up 4.1% at $75.88.
Upside momentum looks to be building with the 30-DMA now at $77.70.
Silver denominated in AUD rose 2.0% last week and closed at $107.25. The 30-DMA is at $110.55 and could be reached over the near-term.
The Gold versus Silver ratio fell 2.5% in favor of Silver last week and settled at 62.30. That means it takes 62.30 ounces of Silver to equal the price of one ounce of Gold.
We expect this ratio to slip back into the 50-handle as Silver outperforms Gold over the next several weeks.
Physical Platinum hit a one-month high at $2122.00 and finished the week at $2045.00.
This represents the first daily close above the 30-DMA since March 11th and suggests the $1732.00 level is a durable low.
Before the conflict in the Middle East, foreign central banks were reducing exposure to USD-denominated assets.
Not just because of the dual risks of rising trade and budget deficits. But also, due to the risks of sanctions and seizure.
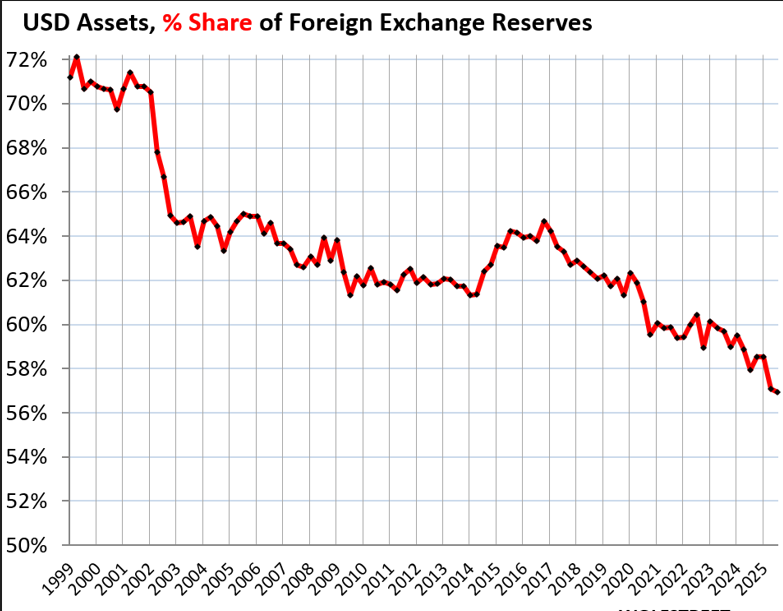
As shown in Chart 2, the percentage of USD reserve assets has been steadily declining since 2001.
USD denominated foreign exchange reserves are US securities held by central banks other than the US Federal Reserve.
They include US Treasury securities, US mortgage-backed securities (MBS), US agency securities, US corporate bonds, and other USD-denominated assets.
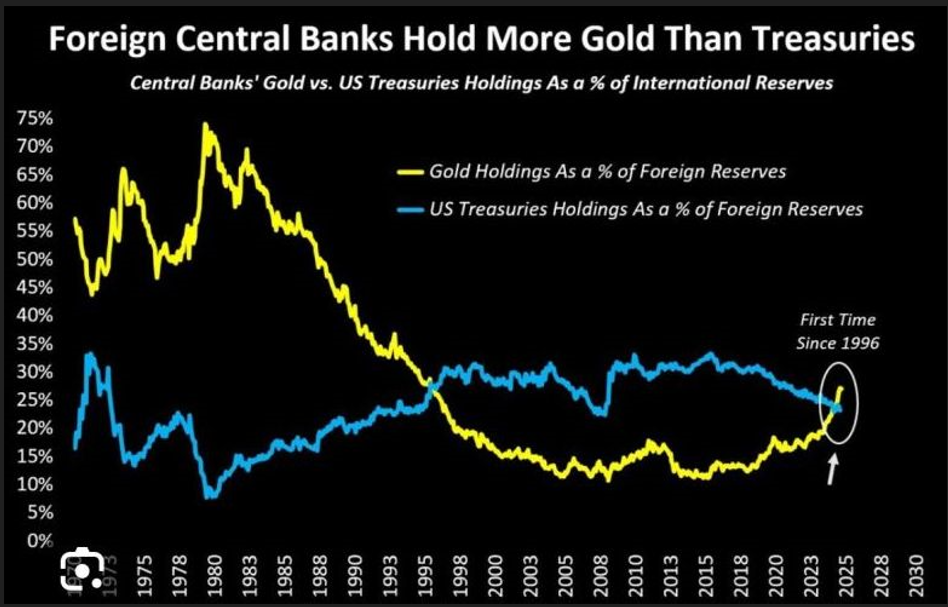
As illustrated on Chart 3, for the first time since 1996, foreign central banks hold more Gold than USD Treasuries.
Gold is not a foreign exchange reserve asset of central banks; it does not involve a foreign currency, and it does not have any counterparty risk.
According to a recent IMF report, Gold holdings by sovereign authorities rose by 0.8% year-over-year to 1,275 million troy ounces at the end of 2025.
Official sovereign Gold holdings at the end of 2025 would be valued at $5.20 trillion at today’s price, compared to $13.0 trillion in total foreign exchange reserves, and $7.40 trillion in USD-denominated foreign exchange reserves.
Regardless of the duration or outcome of the conflict in the Persian Gulf, we believe it is reasonable to expect that due to De-dollarization and a general risk aversion to USD-denominated Treasuries, the reserve asset percentage for Gold will continue to climb.
As such, now is the time to consider adjusting the asset mix of your long-term wealth creation strategy to include a higher weighting of hard assets.
For over a thousand years, Gold, Silver, and Platinum have served as a time-proven store of value and as the purest form of money.
This publication has been prepared for the GBA Group Companies. It is for education purposes only and should not be considered either general of personal advice. It does not consider any particular person’s investment objectives, financial situation, or needs. Accordingly, no recommendation (expressed or implied) or other information contained in this report should be acted upon without the appropriateness of that information having regard to those factors. You should assess whether or not the information contained herein is appropriate to your individual financial circumstances and goals before making an investment decision or seek the help the of a licensed financial adviser. Performance is historical; performance may vary; past performance is not necessarily indicative of future performance. Any prices, quotes or statistics included have been obtained from sources deemed to be reliable, but we do not guarantee their accuracy or completeness.