Gold and Silver Bolt Higher in Front of This Week’s FOMC Rate Decision
Gold and Silver Bolt Higher in Front of This Week’s FOMC Rate Decision
The current leg higher in the precious metals complex began after the soft US Payroll data in August signaled a new easing cycle from the Federal Reserve (FED).
Since then, a series of weaker macroeconomic reports suggest US interest rates could slide quicker and further than the current market expectations.
The forward pricing of these revised expectations has been bullish for physical Gold, Silver and Platinum prices.
Gold priced in USD reached a new all-time high of $3674.00 last Tuesday and finished the week 2.1% higher to close at $3643.00.
Gold denominated in AUD tagged a new all-time high at $5563.00 last Tuesday but was capped by the 1.8% rally in the AUD/USD and slipped lower to close fractionally higher at $5475.00.
Momentum indicators for Gold in both currencies remain elevated but not at extremes, which suggests this week’s fundamental drivers could dictate near-term price direction.
Silver priced in USD posted a new 14-year high at $42.46 last Friday on the way to a 2.85% weekly gain with a closing price of $42.17.
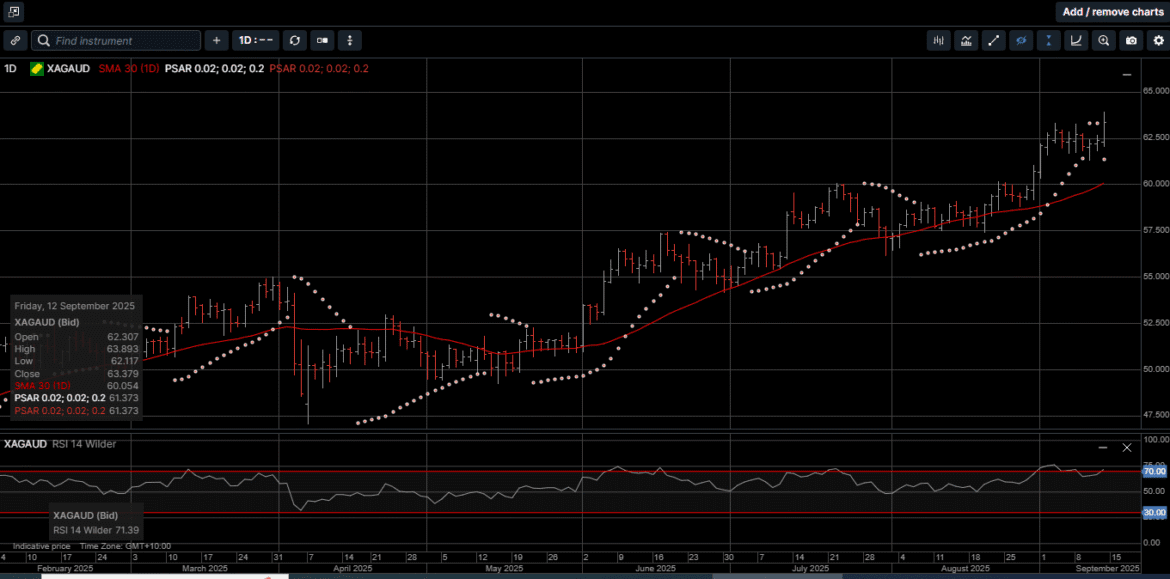
Silver denominated in AUD hit a new all-time high at $63.90 on Friday before drifting slightly lower to finish the week 2.7% higher at $63.38.
The technical picture for Silver in both currencies remains positive but somewhat contingent on the outcome of the FED meeting this Wednesday.
The Gold versus Silver ratio moved 1.2% lower in favor of Silver to close at 86.25. This means it takes 86.25 ounces of Silver to equal the price of one ounce of Gold.
The next key chart point is the low of the year at 84.95. A break of that level could see a quick move into the 81.00 handle.
The physical price of Platinum traded above the $1400.00 level four times last week and closed last Friday 1.3% higher at $1394.50.
The white metal continues to build upside momentum from the intraday spike low of $1254.00 posted on August 20th, and a break above $1425.00 could open substantial upside range extension.
The potential market impact of this week’s FOMC rate decision cannot be overstated.
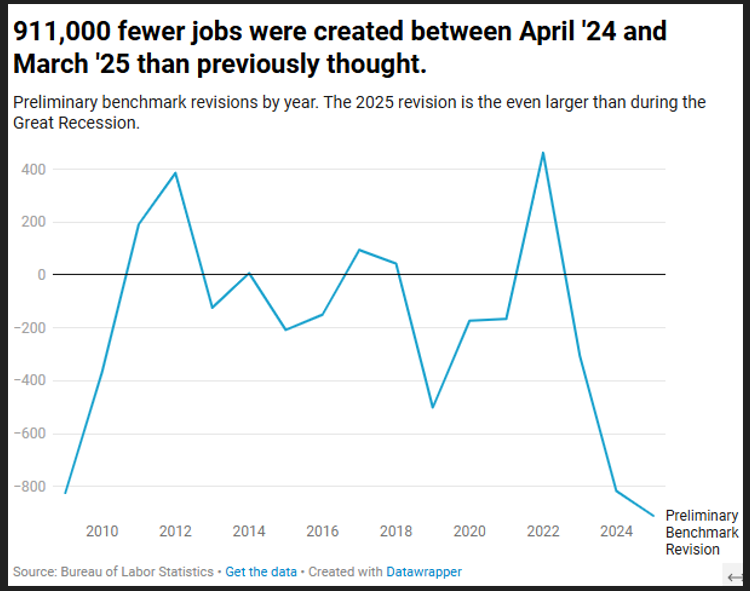
With the main focus of the FED’s next policy move centered on the weakening US labor market, last Tuesday, the Bureau of Labor Statistics (BLS) released the preliminary benchmark payroll revisions for the total 12-month period through March 2025.
As illustrated on Chart 1, the BLS downwardly revised the number of nonfarm jobs created in the period through March 2025 by a whopping 911,000 jobs.
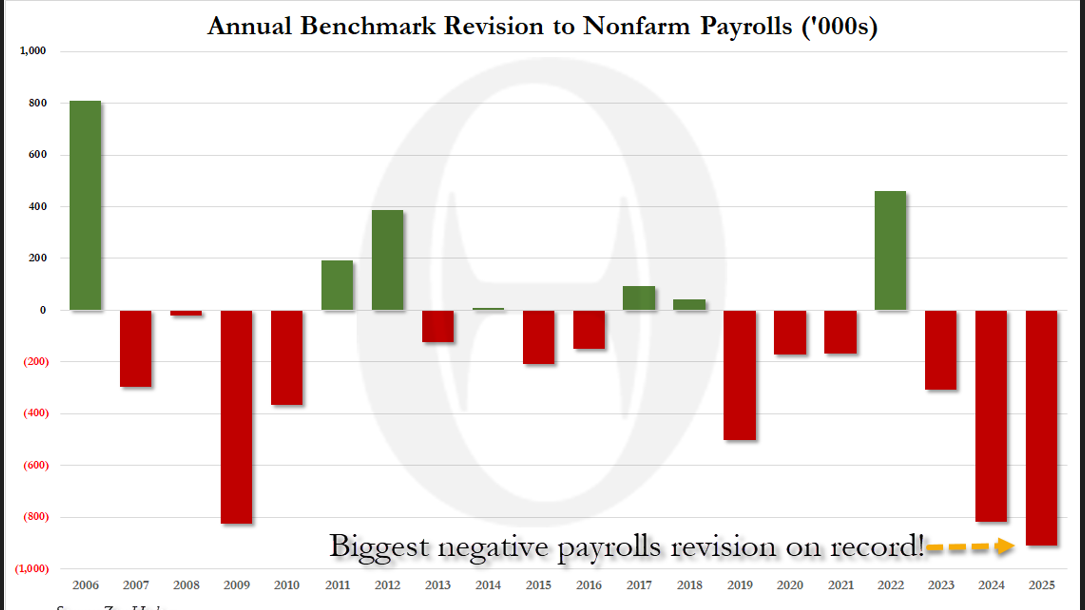
Private sector jobs were revised down by 880,000 jobs; government jobs were revised down by 31,000, which, as shown on Chart 2, is the biggest negative revision on record.
Based on the monthly survey data, the BLS estimated job growth at 2.35 million jobs over the 12-month period through March, or an average of 196,000 per month.
Last week’s revision lowered the pace of job growth to 1.44 million jobs over the 12-month period, or an average of 120,000 per month.
That pencils out to 76,000 jobs per month that were reported but never actually existed, which by any mathematical measure is not a rounding error.
Further, based on the rise in initial jobless claims shown on Chart 3, the US employment outlook isn’t showing any sign of improvement, which will likely lead to more downward revisions.
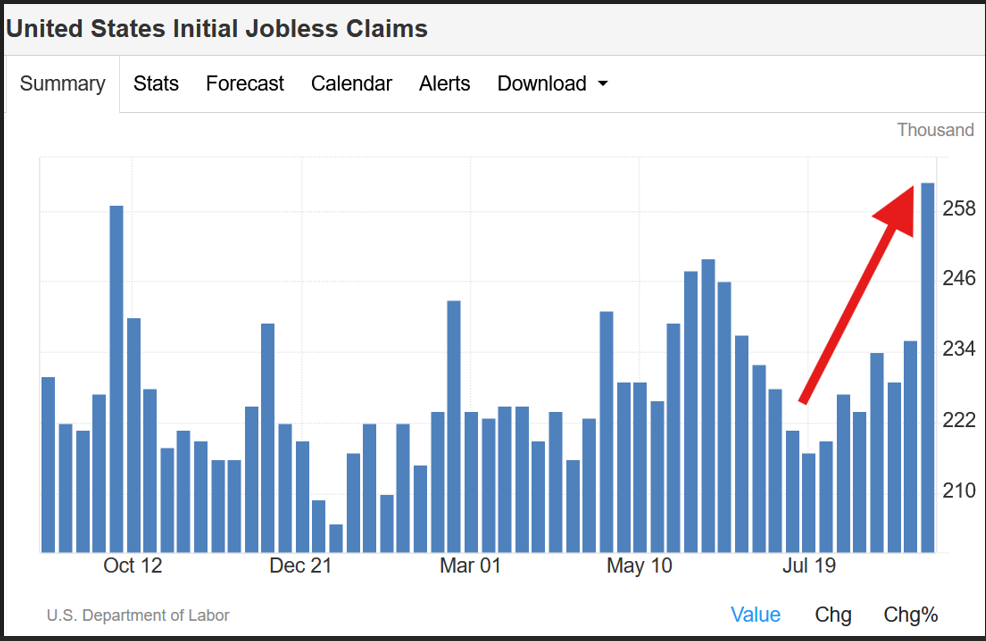
However, one thing that will not be revised away is the trillions in debt accumulated over the last 12 months, which has encumbered US taxpayers with massive amounts of debt only to create far fewer jobs than initially reported.
Against this backdrop, it is not surprising that on a year-to-date basis Gold in USD and AUD terms has returned 38.5% and 29.2%, respectively.
Over the same period of time, Silver based in USD and AUD has returned 46.1% and 35.8%, respectively, while Platinum has gained an eye-watering 54.3% so far in 2025.
Long-term investors should not view Gold, Silver and Platinum as short-term speculative instruments but as a secure store of value.
History shows that precious metals protect against the loss of purchasing power in fiat currencies and safeguard against the risk that counterparties to paper assets may fail to meet their obligations.
In this sense, now is the time to consider holding physical Gold, Silver and Platinum as cornerstone assets in your long-term wealth creation strategy.
Chart 4 – Gold AUD
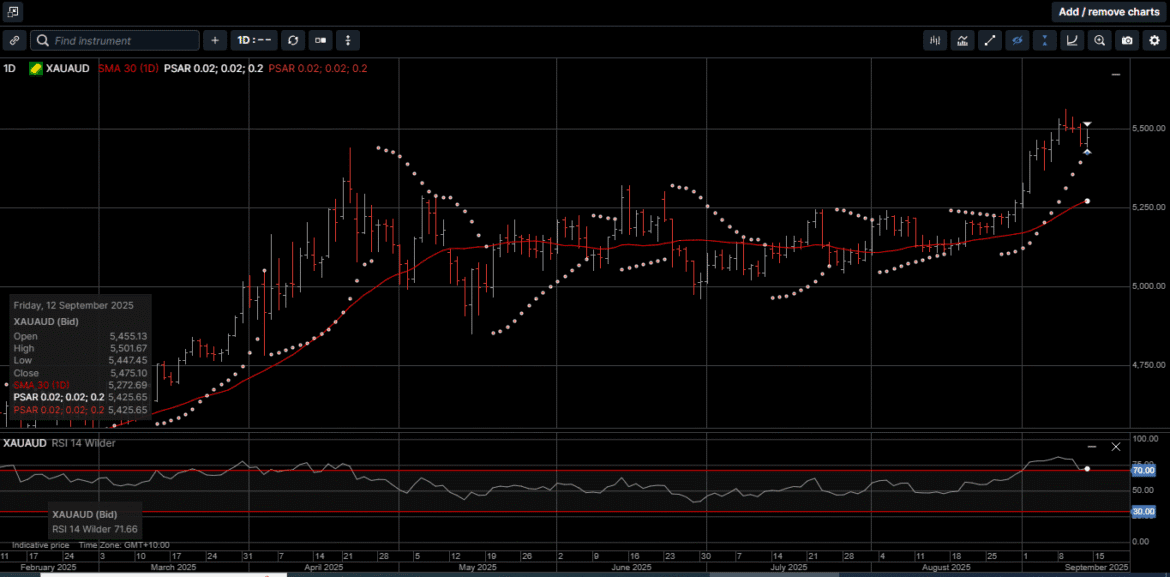
Chart 5 – Silver AUD
This publication has been prepared for the GBA Group Companies. It is for education purposes only and should not be considered either general of personal advice. It does not consider any particular person’s investment objectives, financial situation or needs. Accordingly, no recommendation (expressed or implied) or other information contained in this report should be acted upon without the appropriateness of that information having regard to those factors. You should assess whether or not the information contained herein is appropriate to your individual financial circumstances and goals before making an investment decision, or seek the help the of a licensed financial adviser. Performance is historical, performance may vary, past performance is not necessarily indicative of future performance. Any prices, quotes or statistics included have been obtained from sources deemed to be reliable, but we do not guarantee their accuracy or completeness.