A Technical Breakout in Gold and Silver
A Technical Breakout in Gold and Silver
Weakness in the USD combined with end-of-month operations created a positive trade environment for the precious metals complex last week.
And even though volume numbers were lower in front of the US Labor day holiday, physical Gold and Silver prices broke through some significant chart resistance levels.
With less than three weeks until the next FOMC meeting, a growing number of market commentators are calling for the FED to cut rates by 50 basis points as opposed to 25 basis points, which would be bullish for Gold, Silver and Platinum.
Gold priced in USD hit a four-month high of $3455.00 and closed the week 2.25% higher at $3447.00, which is a new all-time high for a weekly closing price.
Gold denominated in AUD tagged a two-month high at $5276.00 on the way to a 1.5% gain for the week and closed at $5367.00.
Gold in both currencies closed near their highs of the week, which suggests a firm start to this week with US markets closed on Monday.
Silver priced in USD posted a 13-year high at $39.96 on the way to a 4.4% weekly gain to close at $39.74, which is the highest weekly close since September of 2011.
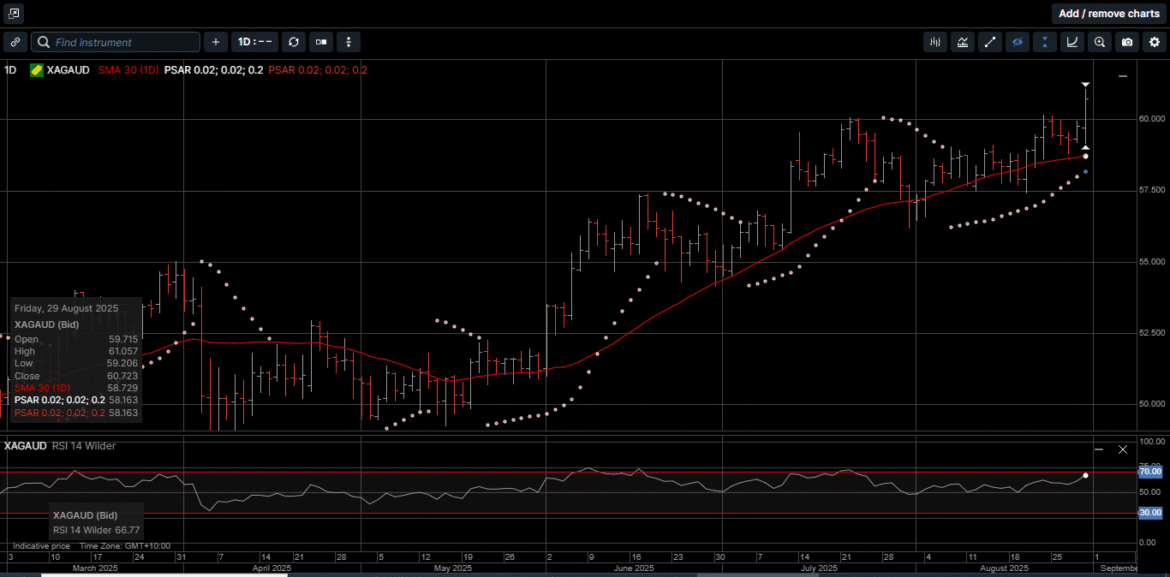
Silver based in AUD rose 1.6% to a new all-time high at $61.05, as well as a new all-time high weekly close at $60.72.
Similar to Gold, the proximity of the closing price to the high price of the week suggests Silver in both currencies could start the new week well bid.
Physical Platinum prices lagged somewhat but still closed half a percent higher at $1370. More significantly, this was the first weekly close above the 30-Day Moving Average since July 29th, which improves the technical tone going forward.
As illustrated on Chart 1, the Gold to Silver ratio closed last week at 86.65. That means it takes 86.65 ounces of Silver to buy one ounce of Gold.
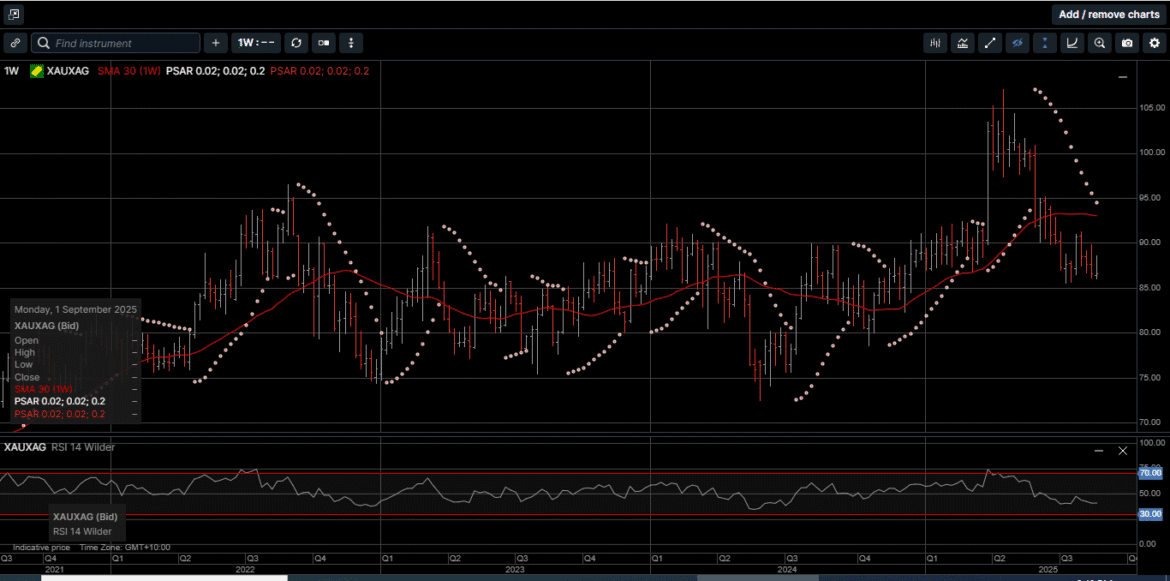
To put the current ratio into perspective, on April 22nd, the Gold versus Silver ratio reached a high of 107.10. In the modern era, this ratio has averaged between 40 to 1 and 70 to 1.
Historically, the ratio has always returned to that mean. And when it does, it does it with a vengeance. The ratio fell to 30-1 in 2011 and below 20-1 in 1979.
In other words, when the Gold to Silver ratio gets as wide as it did in April and then reverses lower, Silver doesn’t just outperform Gold, it has the potential to go on a significant run over a short period time.
Geologists estimate that there are approximately 19 ounces of Silver for every ounce of Gold in the earth’s crust, with a ratio of approximately 11.2 ounces of Silver to each ounce of Gold that has ever been mined.
Since the global economy went to a total fiat money system in the early 1970s, there seems to be some correlation between the Gold to Silver ratio and central bank money creation.
During periods of rapid central bank money-printing, the gap tends to narrow.
For instance, the ratio plummeted in the aftermath of the 2008 financial crisis as the Fed and other G-20 cental banks engaged in extreme monetary policy.
Further, the current price of physical Silver fails to reflect the current supply and demand dynamics.
According to a recent forecast by Oxford Economics, Silver demand for industrial applications, jewelry production, and communication satellite fabrication is expected to more than double over the next 10 years.
As shown on Chart 2, the use of Silver for the automotive sector will drive steady industrial demand to close to 150 million ounces per year by 2040.
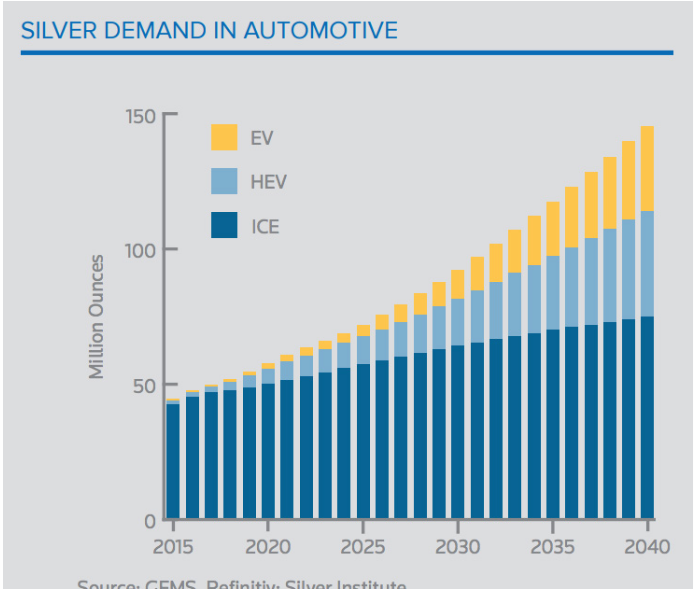
Meanwhile, the new supply of Silver was flat with mine output dropping by 0.6% to around 820 million ounces in 2024
Record global Silver demand and a lack of additional supply contributed to last year’s 240-million-ounce market deficit, which was the second consecutive annual deficit in a row.
As such, it seems the current price of physical Silver does not fully reflect future demand or the growing supply deficit.
It’s important to keep in mind that while Silver is an industrial metal, more fundamentally, it is real money just like Gold and Platinum
Despite being more volatile in the short term, Silver tends to track with Gold over time, and historically, it has outperformed Gold when the ratio widens above 90.00 and then reverses.
Going forward, we believe a Gold versus Silver ratio of 70.00 is a realistic target over the medium term, which is almost a 20% move in favor of Silver from current levels.
As shown on Chart 3, Both Gold and Silver were top performing assets in 2024 and have repeated that performance so far in 2025.
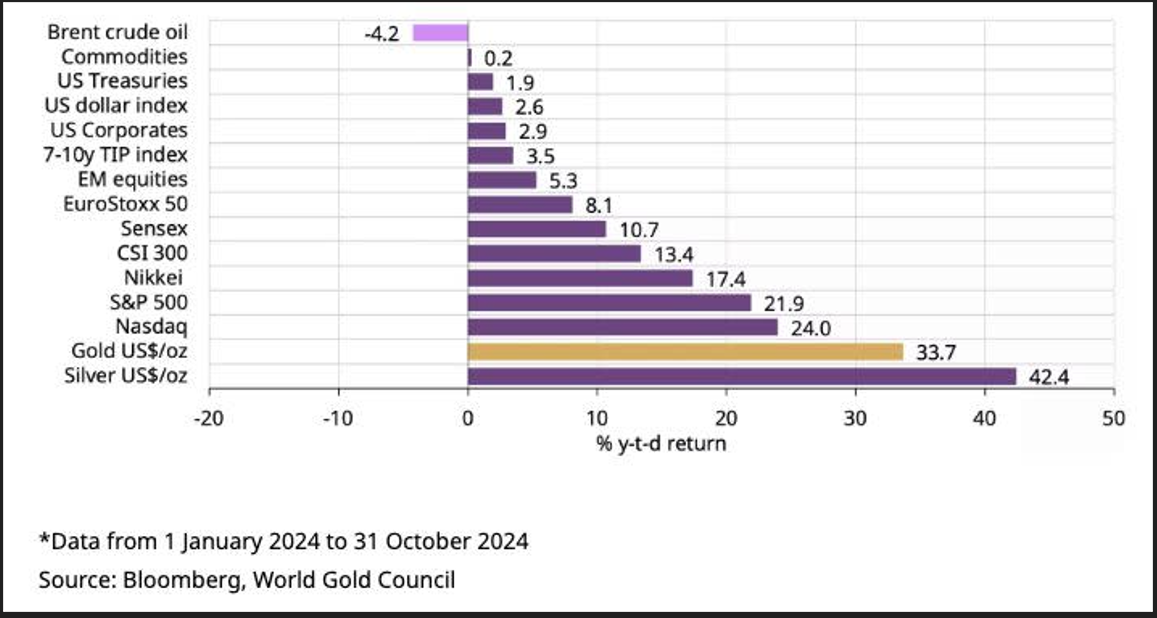
On a year-to-date basis, Gold and Silver priced in USD have returned 31.3% and 37.6%, respectively. Gold and Silver priced in AUD have returned 24.3% and 30.1%, while Platinum has posted an eye-watering 50.5% gain so far in 2025.
Compare these year-to-date returns to the SP 500 (9.1%), the NASDAQ (9.4%) and the Dow Jones 30 (4.1%) and it is clear why a growing number of investors believe that hard assets increase wealth security.
With the US FED close to starting a new easing cycle, the USD trending lower and the level of sovereign debt expanding unbridled, now is the time for long-term investors looking for a secure wealth creation strategy to consider adding more physical Gold, Silver and Platinum to their portfolio.
With many stock indexes near all-time highs, physical precious metals can diversify risk as highly liquid and time-proven safe haven assets.
Chart 4 Gold AUD
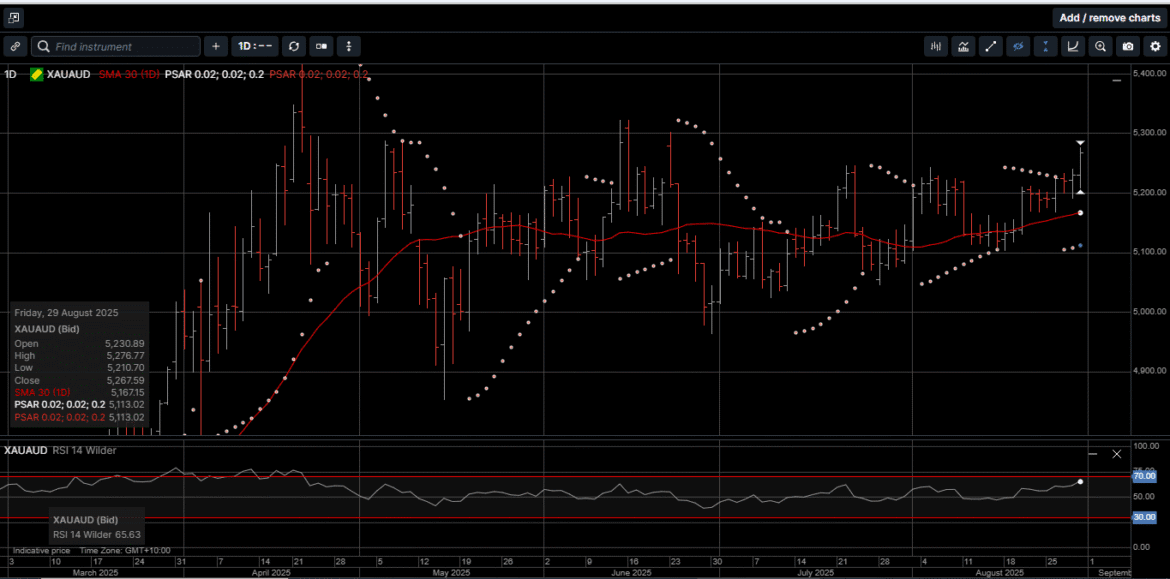
Chart 5 Silver AUD
This publication has been prepared for the GBA Group Companies. It is for education purposes only and should not be considered either general of personal advice. It does not consider any particular person’s investment objectives, financial situation or needs. Accordingly, no recommendation (expressed or implied) or other information contained in this report should be acted upon without the appropriateness of that information having regard to those factors. You should assess whether or not the information contained herein is appropriate to your individual financial circumstances and goals before making an investment decision, or seek the help the of a licensed financial adviser. Performance is historical, performance may vary, past performance is not necessarily indicative of future performance. Any prices, quotes or statistics included have been obtained from sources deemed to be reliable, but we do not guarantee their accuracy or completeness.