Will the US Revalue Fort Knox?
In what can be described as an overdue technical correction, the precious metals complex sold off across the board last week.
From a broader perspective, last week’s price action has alleviated the short-term overbought conditions while maintaining the uptrend chart patterns dating back to last November.
At this point, it would not be surprising to see a brief consolidation phase before Gold and Silver re-establish their bullish price momentum.
After posting a new all-time high of $2956.00 last Monday, Gold priced in USD traded lower for the rest of the week closing 2.6% lower at $2857.00.
Gold denominated in AUD was buffered by the 2.3% fall in the AUD/USD and closed fractionally lower at $4598.00.
It is worth pointing out that Gold priced in both the USD and AUD closed the week above their 30-day moving average levels found at $2850.00 and $4529.00, respectively.
The same can’t be said for physical silver prices which were under pressure every day last week.
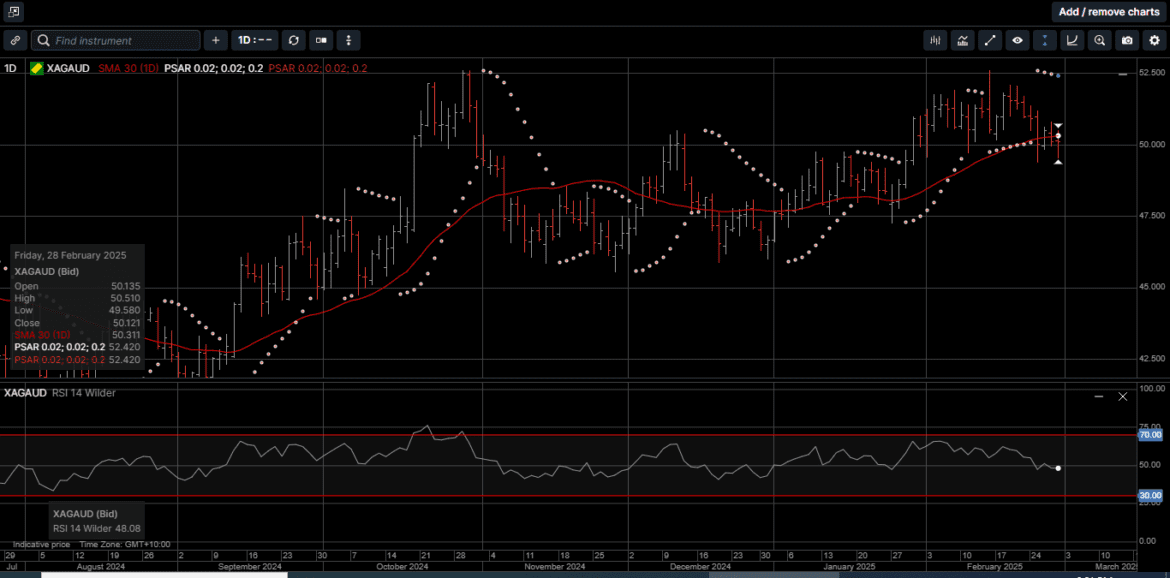
Silver priced in USD slipped 4.1% lower to close at $31.15, while AUD-based Silver fell 1.7% to finish the week at 50.12.
The Gold versus Silver ratio traded up to 92.40, which is the highest level since September of 2022, before settling at 91.60. This means it takes 91.60 ounces of Silver to equal 1 ounce of Gold.
When the price of USD Gold reached an all-time high of $2,956.00 per ounce last Monday, its market capitalization rose above $20 trillion for the first time ever.
And while safe-haven demand has certainly been a driver for the yellow metal, there’s another potential catalyst that could send prices even higher this year: the revaluation of America’s Gold reserves.
As illustrated on Chart 1, the US reportedly holds the most Gold of any country on earth by far, with reserves totalling 8,133 metric tons.
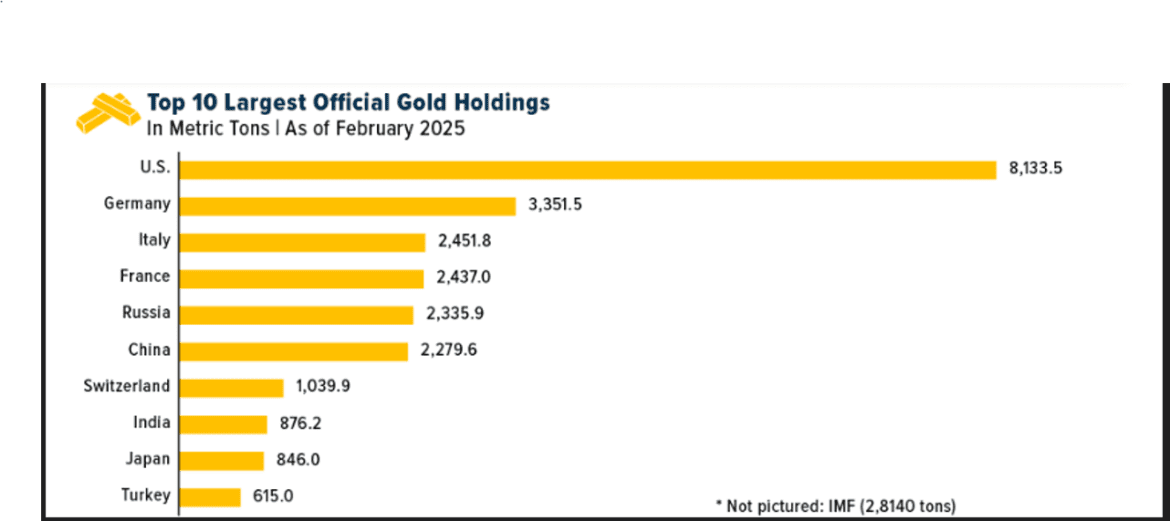
But what’s less well-known is that the stockpile’s value has remained at just $42.00 per ounce since 1973, putting its total value at around $11 billion.
Let’s say the US administration were to revalue those reserves at the recent price of around $2,900, which some officials are in favor of. The total value, then, would jump to a staggering $760 billion, creating a windfall of $749 billion.
This could provide the US government with options to sell a portion of its Gold or enhance its balance sheet by reducing debt.
It could even be used to fund a Sovereign Wealth Fund, which has been discussed by lawmakers.
Before any Gold revaluation can occur, though, it’s probably best to verify that the Gold reserves actually exist, which is a concern that’s lingered for decades.
The US Bullion Depository at Fort Knox, Kentucky, which houses the bulk of the nation’s Gold, has only opened its doors to non-authorized personnel three times in history: 1) in 1943 for President Franklin D. Roosevelt, 2) in 1974 for a small group of Congressmen and 3) in 2017 for a delegation including then-Treasury Secretary Steven Mnuchin.
Several US officials have recently announced plans to conduct an in-person audit of Fort Knox’s Gold reserves on behalf of the cost-cutting operation, the Department of Government Efficiency, or DOGE.
However, an audit of Fort Knox would not be a week long project.
There is estimated to be 370,000 400-ounce Gold bars distributed within the 13 vaults at Fort Knox.
Even if a team of auditors could check and verify 20 bars per hour, a comprehensive and complete audit would take more than two years.
We don’t doubt that the Gold is where it should be, but we agree with efforts to provide transparency.
The overarching point is that when the US Treasury is considering revaluing their Gold reserves, it underscores the prominence and demand for Gold as a primary asset.
As we have reported in previous newsletters, central banks have been on a Gold buying spree, having snapped up over 1,000 tons of the metal for the third consecutive year in 2024.
Central banks are often considered the “smart money” in the Gold market, and their sustained accumulation of Gold reflects a broader strategy to diversify reserves and hedge against their very own policies.
On the supply side, as shown on Chart 2, total Gold production rose to a record 4,974 tons in 2024, driven by increased mining output and recycling.
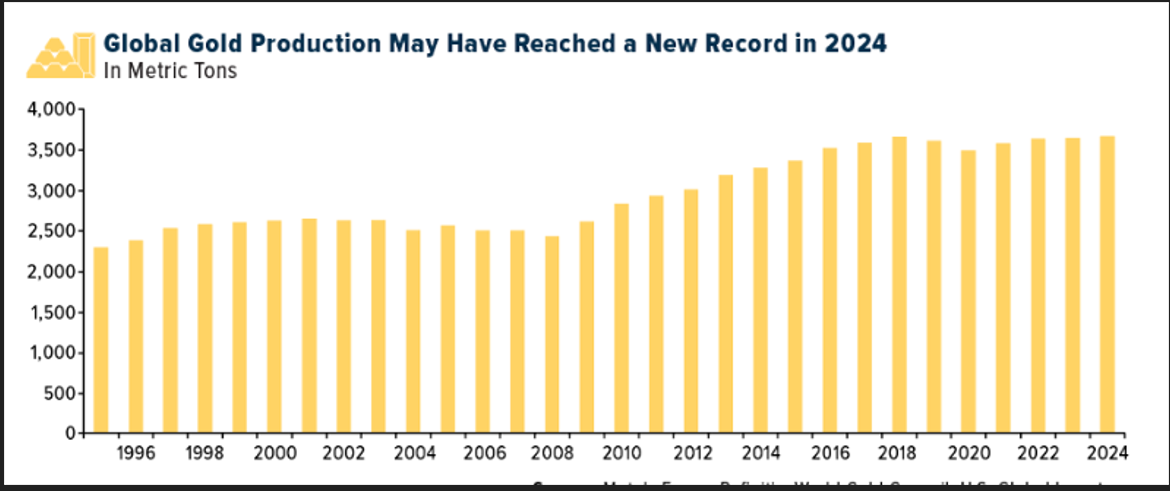
However, the long-term supply outlook is less rosy.
According to a recent report from the World Gold Council, the Gold supply is expected to peak in 2026 before declining as a result of fewer new discoveries.
Exploration budgets, which surged to $7 billion in 2022, have cooled off but remain higher than historical averages. This trend could support higher Gold prices over the medium to long term, particularly if demand from central banks and investors remains robust.
This is in addition to the three yearlong supply deficits in physical Silver.
So what does all this mean for your portfolio?
Both Gold and Silver remain vital assets for diversification.
It is reasonable to expect their role as a hedge against inflation, currency devaluation and geopolitical risks is as relevant today as ever for long-term investors looking to protect their wealth.
We consider last week’s pullback in Gold and Silver prices an opportunity to increase physical holdings as part of a diversified portfolio within a long-term wealth creation strategy.
Chart 3 – Gold AUD
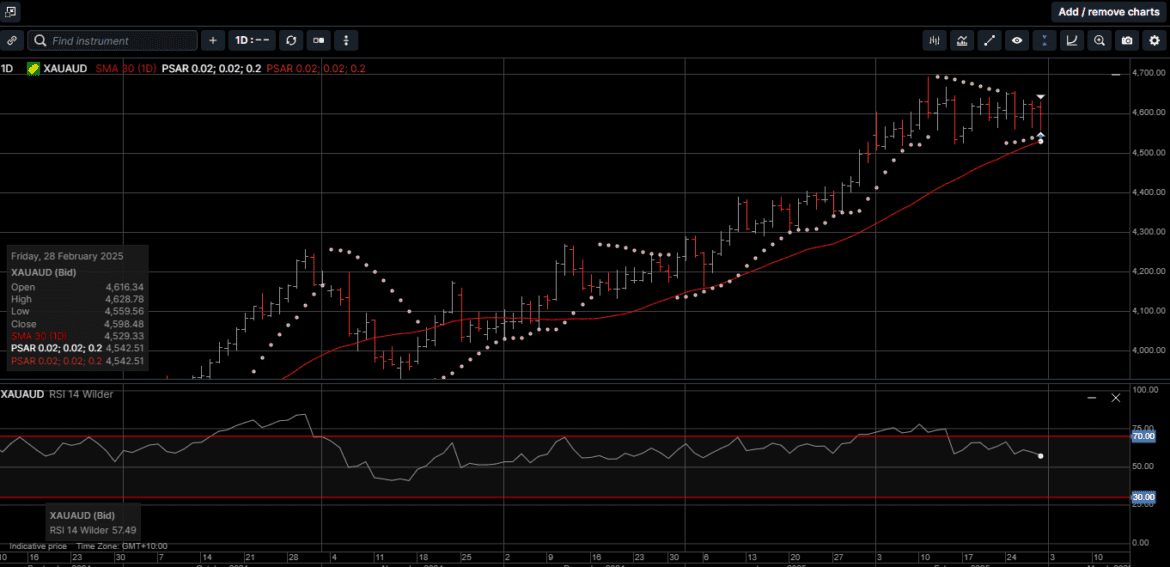
Chart 4 – Silver AUD
This publication has been prepared for the GBA Group Companies. It is for education purposes only and should not be considered either general of personal advice. It does not consider any particular person’s investment objectives, financial situation or needs. Accordingly, no recommendation (expressed or implied) or other information contained in this report should be acted upon without the appropriateness of that information having regard to those factors. You should assess whether or not the information contained herein is appropriate to your individual financial circumstances and goals before making an investment decision, or seek the help the of a licensed financial adviser. Performance is historical, performance may vary, past performance is not necessarily indicative of future performance. Any prices, quotes or statistics included have been obtained from sources deemed to be reliable, but we do not guarantee their accuracy or completeness.