Volatility Rises as Gold Approaches $3000.00
Financial markets remain jittery about the spectre of a tariff driven global trade war.
The US threat of aluminium and steel tariffs and reciprocal tariffs initially shook the markets, but the implementation at some future date gives the impression that the threats are negotiating tactics which helped take away the sting as the week progressed.
And even though last week’s US inflation data printed hotter than expected, the USD followed treasury yields lower as the precious metals complex saw punctuated strength.
Gold priced in USD tagged a new all-time high of $2942.00 before sliding back to $2882 to finish the week just shy of 1.0% higher.
Gold denominated in AUD also reached a new all-time high of $4692.00 but reversed lower on Friday to close out the week fractionally lower at $4534.00
USD based Silver reached a four-month high of $33.40 but met strong selling, which drove the price back to $32.15 or 1.1% higher for the week.
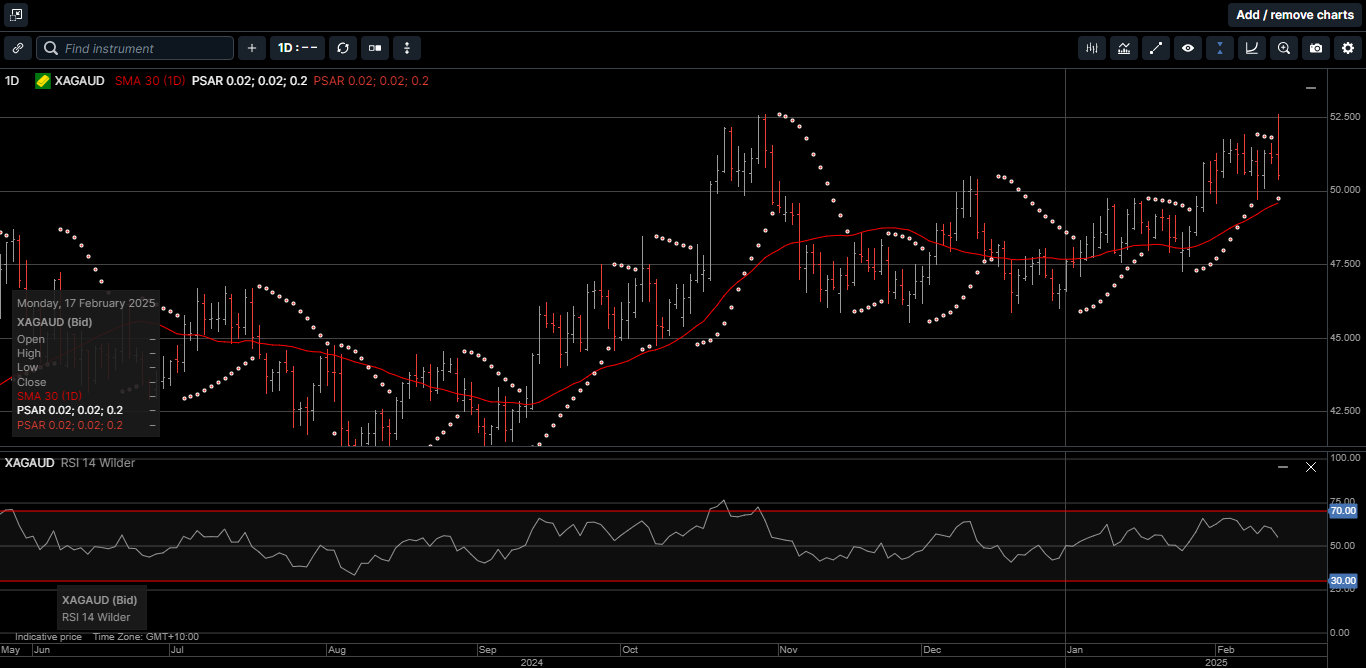
Silver priced in AUD equalled the previous all-time high of $52.60 on Friday but was unable to break higher and drifted lower into the weekend to close fractionally lower at $50.53.
As illustrated on Chart 1, the Gold versus Silver ratio posted its widest daily trading range of the year at over 5.00% last Friday and closed at 89.50.
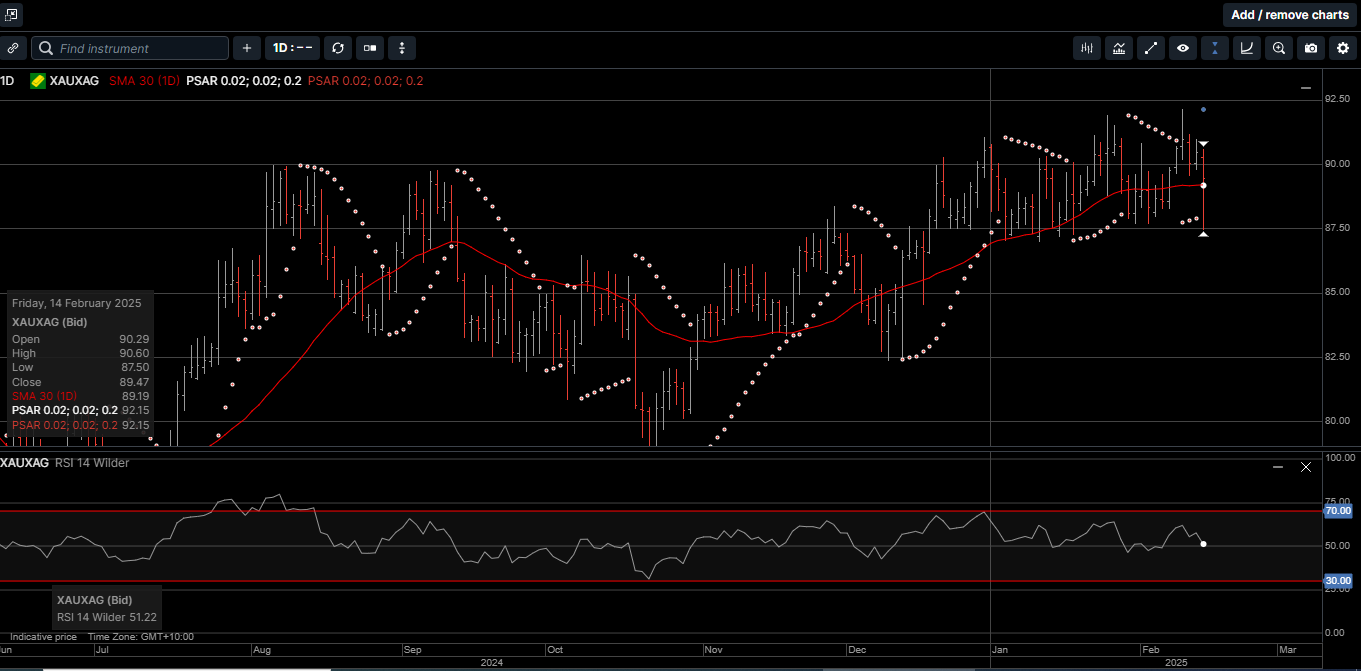
This means it takes 89.50 ounces of Silver to equal the price of one ounce of Gold.
There are several market commentators looking for physical Silver to outperform Gold this year, which would see this ratio trend lower.
However, at the same time, a growing number of Gold bulls are considering $3,000.00 as just another technical level in the yellow metal’s upward trajectory.
In fact, many are now looking at Gold’s inflation-adjusted all-time high, which is between $3,400 and $3550, depending on the inflation data.
Gold’s all-time record high was set in January 1980 when prices hit $875.00 an ounce. This peak was the culmination of a nearly four-year rally that began in August 1976.
While this inflation-adjusted target range may seem ambitious to some, many analysts note that the same factors that fueled Gold’s rally back in 1980 are once again at play today.
Geopolitical uncertainty seems to be surging throughout global financial markets as investors express concern that U.S. President Donald Trump will push the world into a trade war.
Despite Mr. Trump’s campaign promises to end Russia’s war in Ukraine, there are still no signs of peace.
Even when this conflict eventually ends, the divisions between allies and adversaries will likely persist, especially as China and the US continue their struggle for global economic dominance.
This uncertainty is weighing on global growth and fuelling inflation concerns, which increases the level of uncertainty for investors
A series of reciprocal tariffs could drive consumer prices higher worldwide
The protracted strength in the physical Gold and Silver markets reflect the growing fragmentation of the global economy; since they are both assets that carry no geopolitical third-party risk, making them an essential global standard of value.
As shown on Chart 2, the biggest driver of Gold remains central bank demand. Data from the World Gold Council shows that central banks bought over 1,100 tons of physical Gold last year.
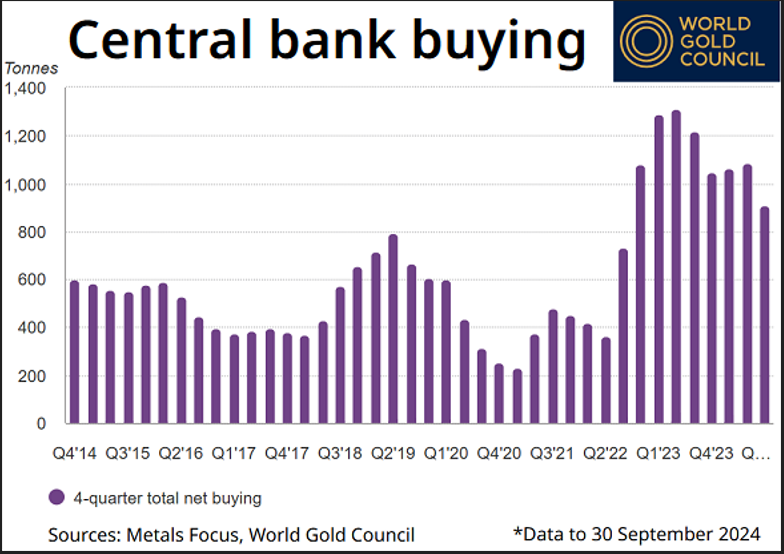
This steady demand significantly exceeded expectations and marked the third consecutive year in which central banks acquired more than 1,000 tons of Gold
Central bank physical Gold buying accounted for roughly 20% of total global demand, which reached a record high last year.
According to some analysts, this sector of the market is the biggest reason why private investors should pay attention to both Gold and Silver.
Central banks represent real value in the global marketplace.
Central banks are not speculative investors chasing the next big trend; they are serious portfolio managers focused on preserving their nations’ wealth and purchasing power over several decades.
As such, with major stock indexes near all-time highs and global economic instability becoming more pervasive, physical Gold and Silver remain important cornerstone assets for diversification and wealth creation within a long-term portfolio.
Chart 3 Gold AUD
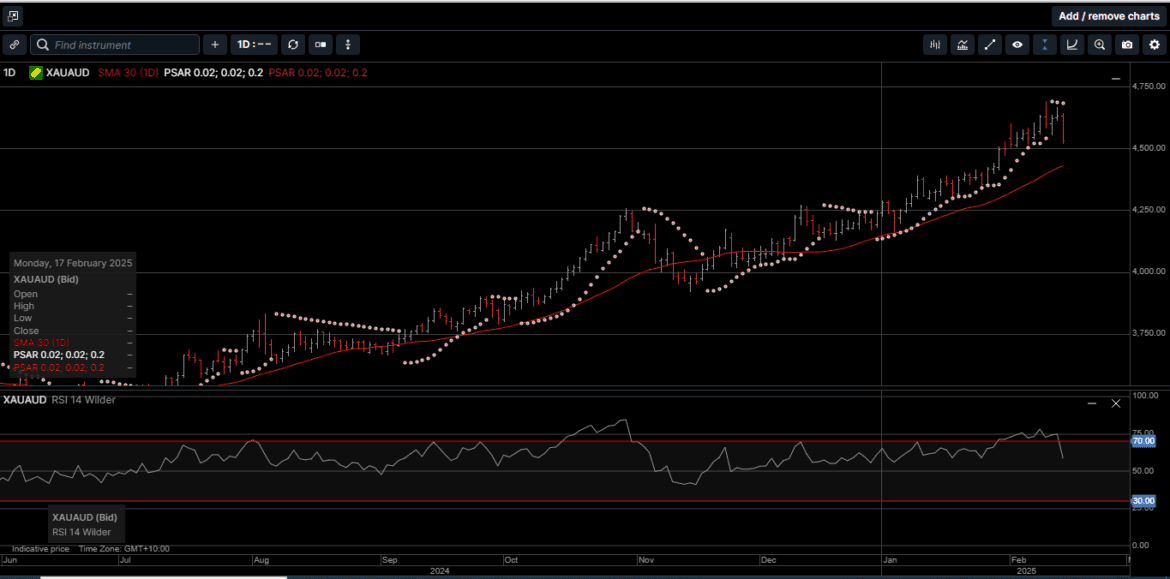
Chart 4 Silver AUD
This publication has been prepared for the GBA Group Companies. It is for education purposes only and should not be considered either general of personal advice. It does not consider any particular person’s investment objectives, financial situation or needs. Accordingly, no recommendation (expressed or implied) or other information contained in this report should be acted upon without the appropriateness of that information having regard to those factors. You should assess whether or not the information contained herein is appropriate to your individual financial circumstances and goals before making an investment decision, or seek the help the of a licensed financial adviser. Performance is historical, performance may vary, past performance is not necessarily indicative of future performance. Any prices, quotes or statistics included have been obtained from sources deemed to be reliable, but we do not guarantee their accuracy or completeness.