The Gold Versus Silver Ratio is Back in Focus
The Gold Versus Silver Ratio is Back in Focus
Last week’s price action in Gold and Silver was driven by two important but divergent narratives.
On the one hand, the rising level of hostility between India and Pakistan sparked a bid in the safe haven assets early in the week.
While on the other hand, optimism surrounding the trade negotiations between the US and China capped the upside in the precious metals complex going into the weekend.
For the week, physical Gold priced in USD tagged a high of $3435.00 on Tuesday before sliding lower to close the week at $3324.00, which represented a 2.5% gain.
The intraday price volatility in USD Gold was extremely high last week with three of the five trading sessions covering over $100.00 from high to low and a weekly price range of over 6.00%.
Gold denominated in AUD rose by 3.0% to close at $5179.00. AUD Gold improved its technical outlook by tagging the $5200.00 level on Tuesday and trading above the 30-day moving average of $5115.00 during every session last week.
Physical Silver priced in USD climbed as high as $33.25 before drifting lower to close out the week 2.5% higher at $32.80.
Interestingly, USD Silver has traded on both sides of the 30-day moving average during nine of its last 10 trading sessions. From a technical perspective, this consolidation suggests a break higher along the established trend line dating back to August of last year.
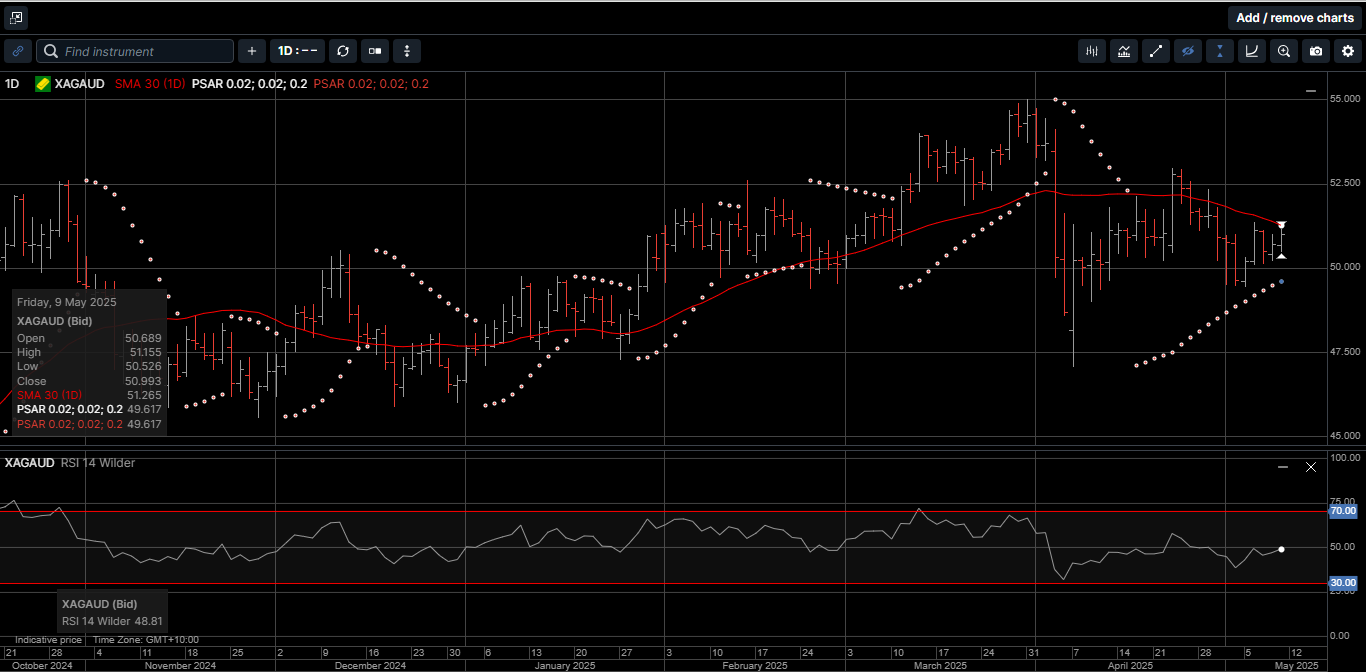
Silver denominated in AUD continues to build upside momentum and rose 2.7% to finish the week at $51.05.
As illustrated on Chart 1, the Gold versus Silver ratio remains contained within the broad 107.15 to 97.50 range established in the middle of April.
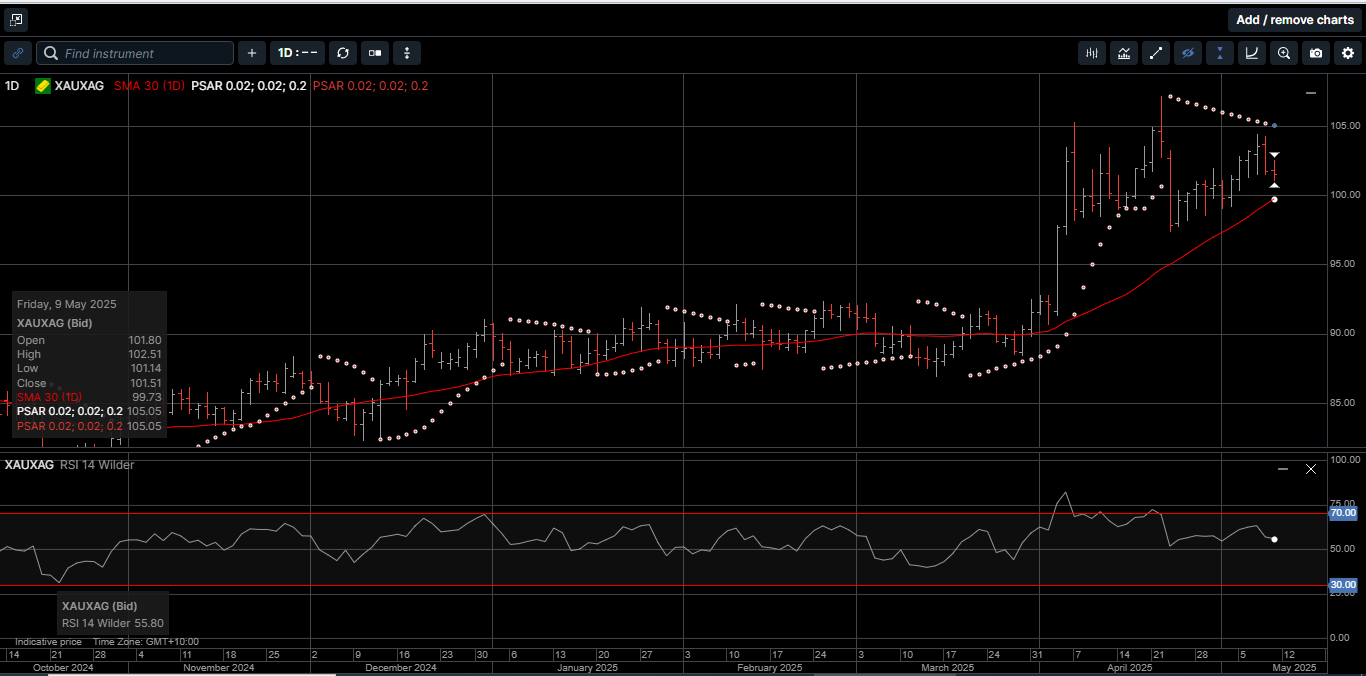
The ratio closed last week at 101.50, which means it takes 101.50 ounces of Silver to equal the price of one ounce of Gold.
We’ve seen a fair amount of divergence in this ratio over the past few weeks; and we’ve seen it on a larger scale over the past year.
This is because Gold has been regularly setting new all-time record highs, while Silver has remained well below its $50.00 high from April of 2011.
So, what is driving Gold, but has not yet pushed Silver up as aggressively?
The primary answer can be found by looking at the money flows.
At this point we’ve all heard about how the central banks have been setting records for the amount of Gold purchased over the past 3 years.
Yet aside from Russia, who mentioned purchasing physical Silver in their budget last year, we’ve still not seen large sovereign purchases of Silver like we have with the yellow metal.
And looking at the numbers, you can see the difference.
Have a look at Chart 2, which is the 2024 investment demand numbers from the World Gold Council.
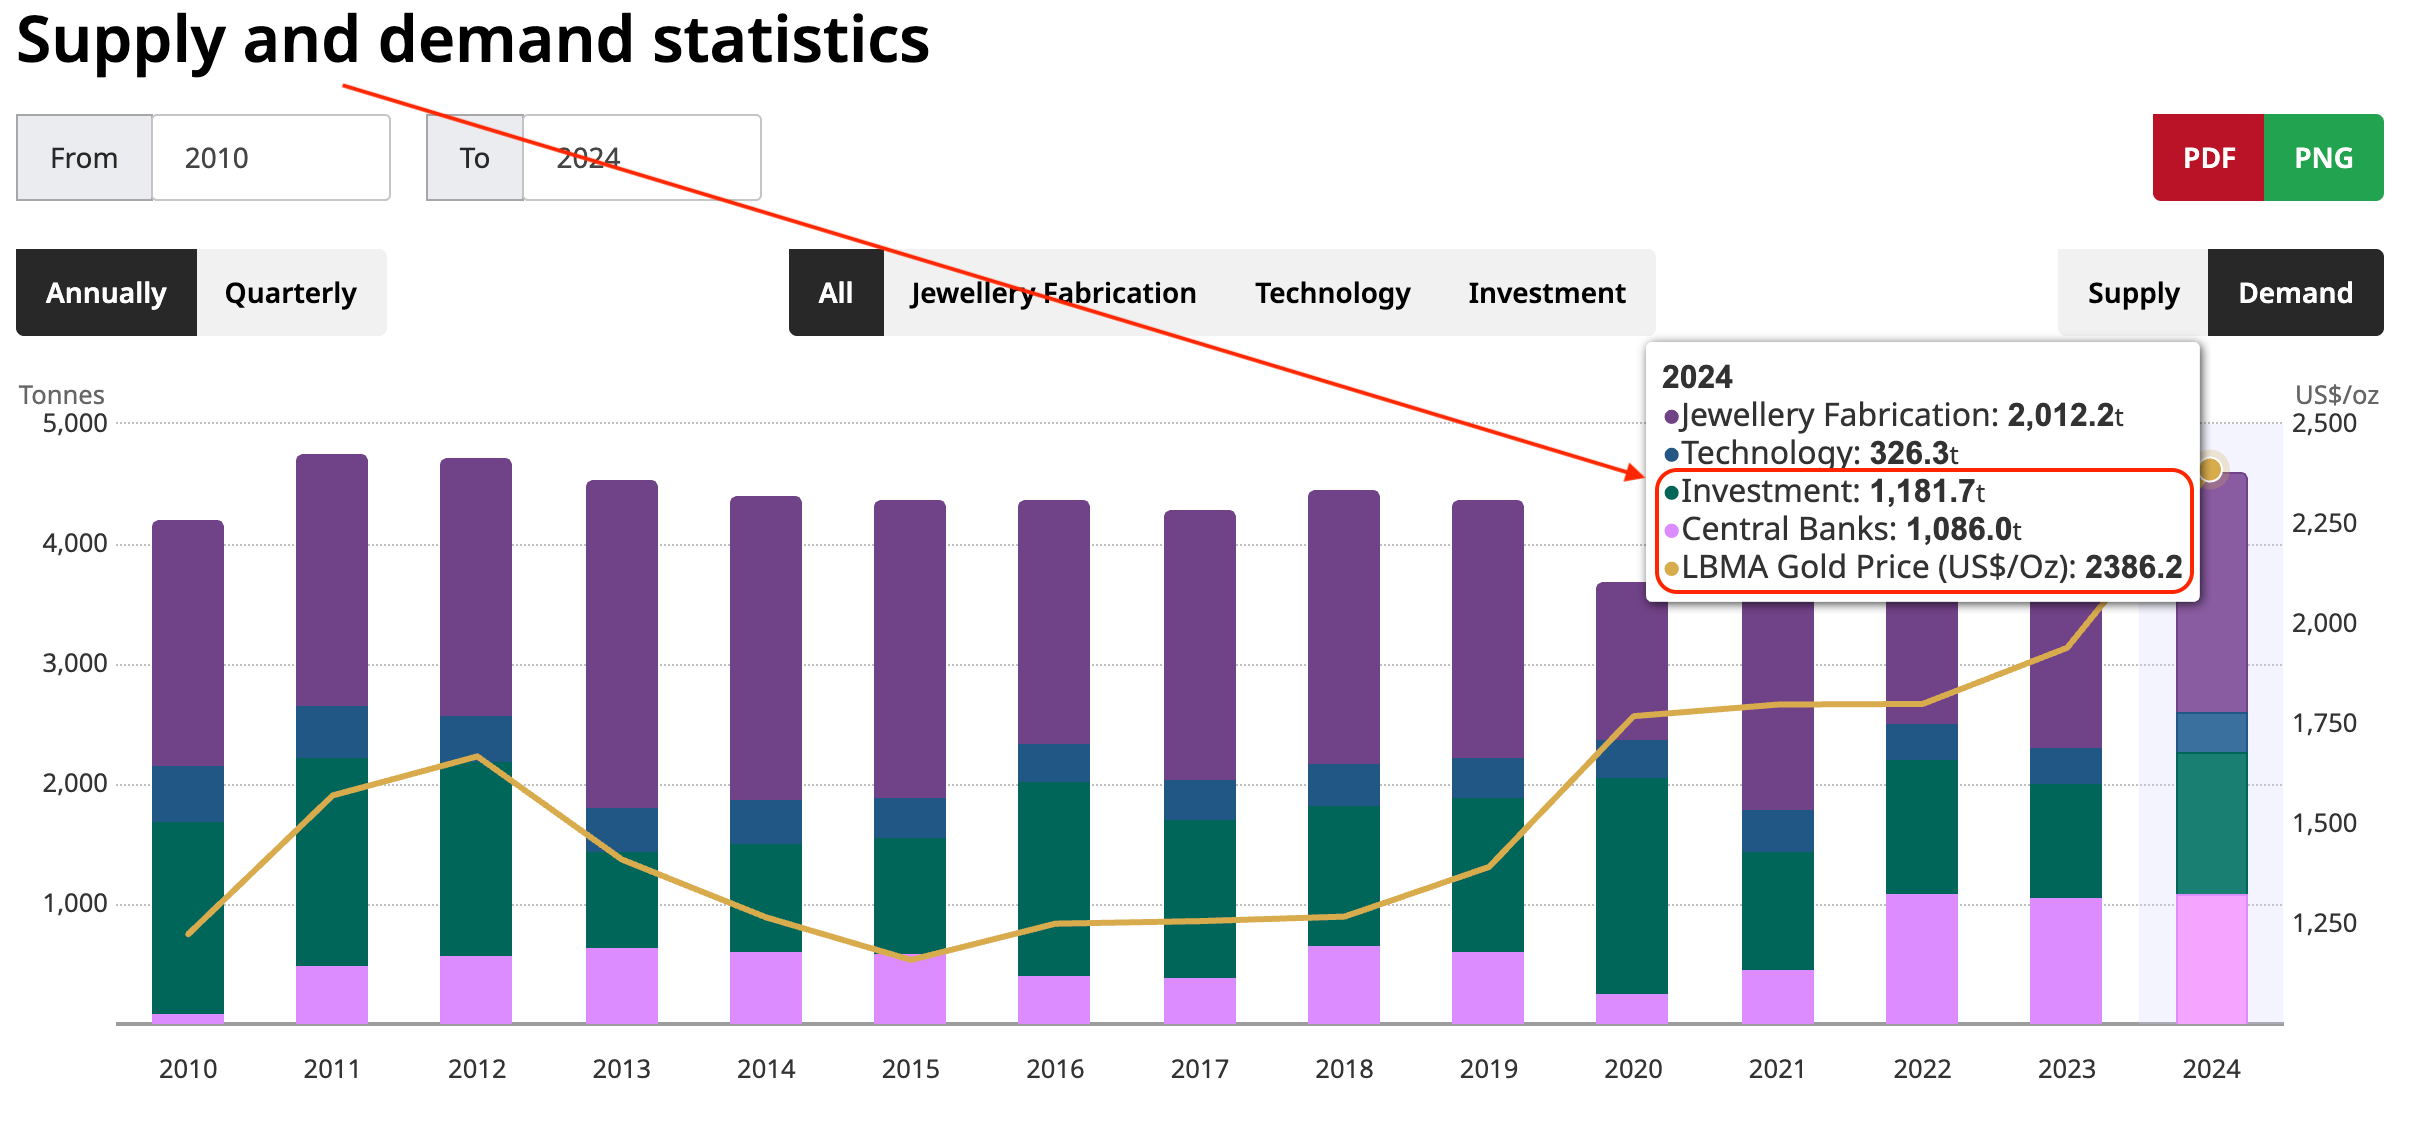
Combining what the World Gold Council labels investment, along with Central Bank purchases, gives you a total of 2267.7 tons.
That pencils out to 80 million ounces, times an average Gold price of $2,386, which gives you a total of $190.8 billion.
If you perform the same exercise in Silver, last year’s investment total of 190 million ounces, multiplied by an average silver price of $28.25, gives you a total of $5.4 billion.
Which equates to a Gold to Silver investment ratio of 35.3 to 1.
Clearly, that’s a lot lower than the current 101.50 to 1 Gold to Silver ratio, yet we can understand just how much more money is going into Gold right now compared with Silver.
However, it’s worth pointing out that one of the things that’s so attractive about the Silver investment profile is that last year 67% was consumed by industry (680 million ounces of industrial demand, out of a total supply of 1.02 billion ounces).
Based on last month’s bullion report, the COMEX exchange Silver vaults hold 22,120 tons, but 16,200 of those tons are accounted for by the Exchange Traded Funds (ETFs), leaving 5,920 tons in the ‘free float.’ That equals about 209 million ounces.
And that 209 million ounces is just a million ounces shy of the 210 million ounce deficit the Silver Institute reported in their latest World Silver Survey for 2024, if you include the metal that went into the ETFs.
There are many moving parts in the Silver pricing dynamic, yet the possibility of a supply gap remains a concern in the Silver market going forward.
Comparatively, that’s not so much the case for physical Gold which is not used as extensively in manufacturing.
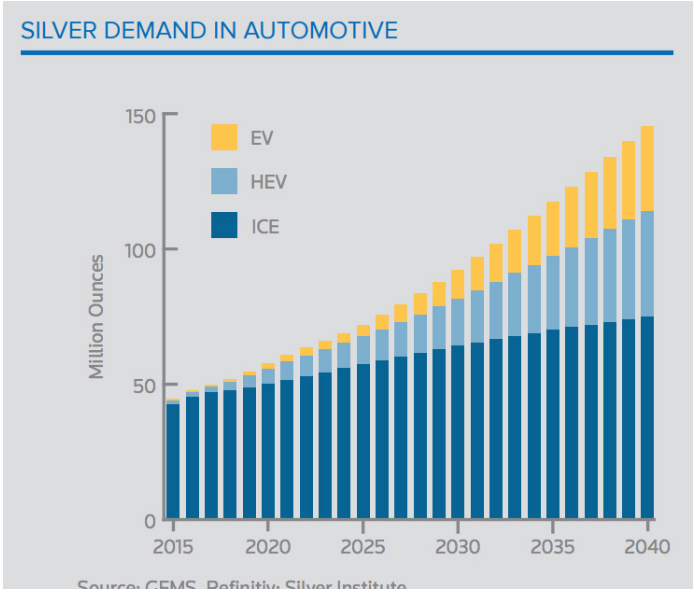
For example, as shown on Chart 3, the demand for Silver in the automotive industry has a steady slope higher over the next 15 years.
As such, with the Silver market demand outpacing the supply again this year, and the prospects of tariff resolution stimulating global manufacturing, it’s reasonable to expect that the Gold versus Silver ratio could revert back to the traditional ranges around 70.00 to 80.00 over the medium term.
From a broader investment perspective, both Gold and Silver represent a store of value and are the purest forms of money.
With their immutable physical properties, worldwide recognition and lack of counterparty risk, Gold and Silver serve as uniquely effective assets for investors looking for a secure, long-term wealth creation strategy.
With the precious metals pulling back from the recent highs, now is the time to consider the benefits of making physical Gold and Silver the cornerstone asset within your diversified portfolio.
Chart 4 Gold AUD
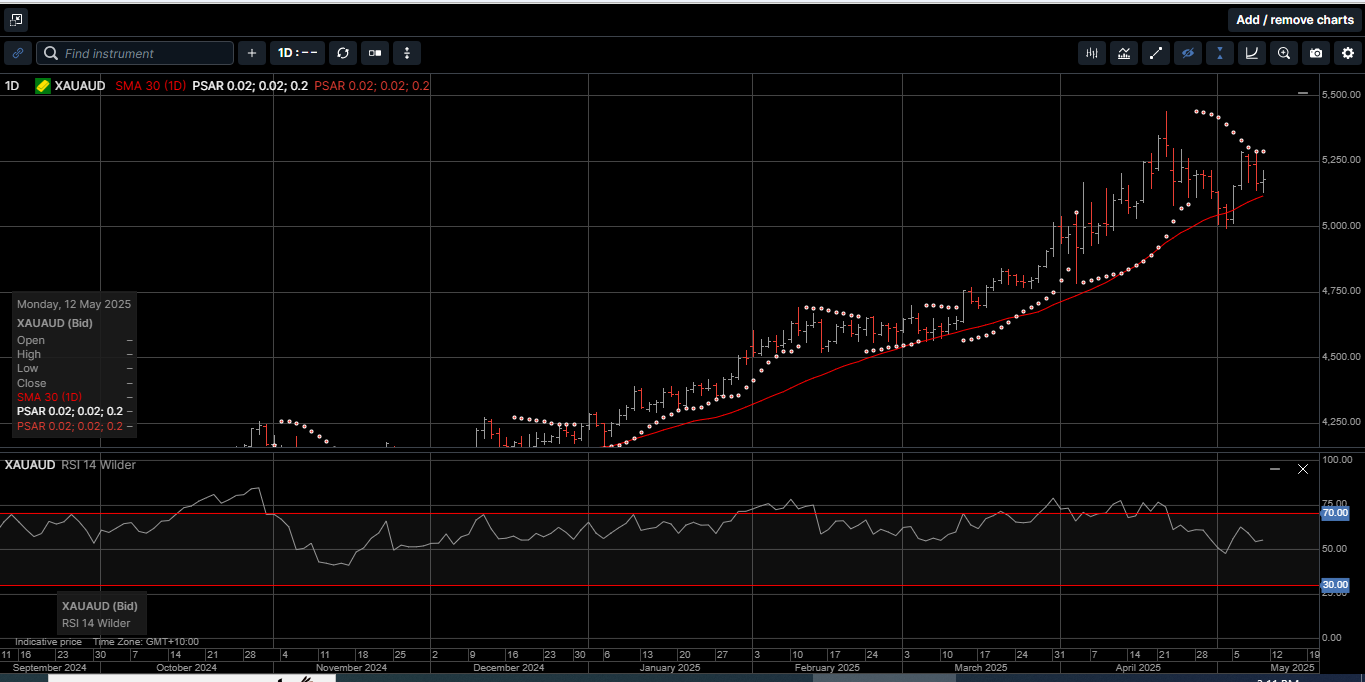
Chart 5 Silver AUD
This publication has been prepared for the GBA Group Companies. It is for education purposes only and should not be considered either general of personal advice. It does not consider any particular person’s investment objectives, financial situation or needs. Accordingly, no recommendation (expressed or implied) or other information contained in this report should be acted upon without the appropriateness of that information having regard to those factors. You should assess whether or not the information contained herein is appropriate to your individual financial circumstances and goals before making an investment decision, or seek the help the of a licensed financial adviser. Performance is historical, performance may vary, past performance is not necessarily indicative of future performance. Any prices, quotes or statistics included have been obtained from sources deemed to be reliable, but we do not guarantee their accuracy or completeness.