Safe Havens Push Higher on Middle East Conflict
Safe Havens Push Higher on Middle East Conflict
Military hostilities have once again erupted in the Middle East as Israel and Iran have exchanged airstrikes over the last several days and battle damage in both nations continues to rise.
The market reaction to last Friday’s initial bombing operations was a sharp selloff in global equity markets and a reflexive flight to safety in the precious metals and energy complexes.
Physical Gold priced in USD posted an intraday high of $3447.00 and finished the week 3.8% higher at $3432.00, which is a new all-time high daily and weekly closing price.
Gold denominated in AUD was also well bid hitting a two-month high at $5322.00 and closing 3.7% higher at $5284.00.
On a year-to-date basis, USD and AUD Gold prices are up by 31.2% and 24.7%, respectively.
Physical Silver spent most of last week consolidating the strong gains from the previous week but found buyers into the weekend.
Silver based in USD tagged a new 13-year high at $36.88 and closed the week 1.1% higher at $36.30.
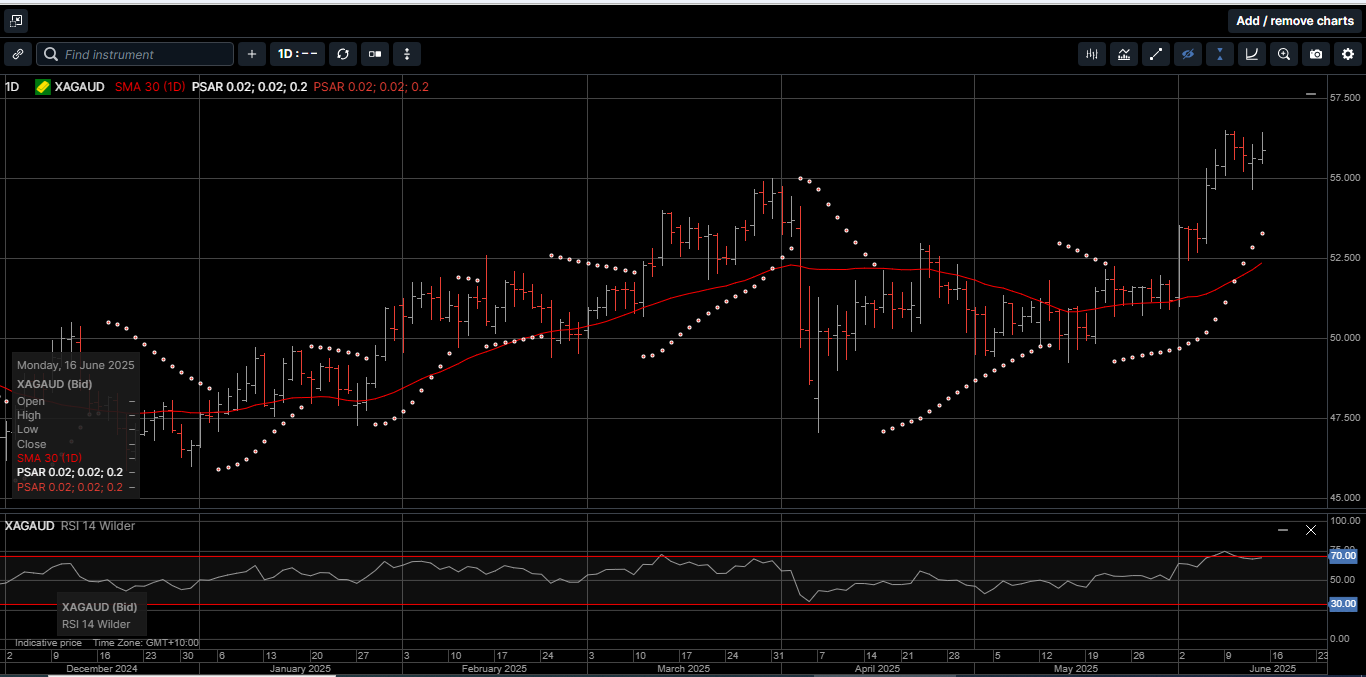
Silver denominated in AUD hit a new all-time high at $56.52 before slipping slightly lower finish the week 1.0% higher at $55.87.
On a year-to-date basis, USD and AUD Silver have returned 25.6% and 19.7%,, respectively.
After hitting a three-month low of 90.24, the Gold versus Silver ratio moved higher in favor of Gold to finish the week at 94.50, which means it takes 94.50 ounces of Silver to equal the price of one ounce of Gold.
At this point in the conflict, increasing levels of military engagement between Israel and Iran appear more likely than a swift diplomatic resolution.
Looking past the turmoil in the Middle East, this week’s US Federal Open Market Committee (FOMC) meeting has the potential to drive US, as well as global asset prices.
Ahead of its next interest rate decision on June 18, FOMC members are now in a blackout period.
The blackout regulations limited public comments on monetary policy last week, but recent speeches suggest that Wednesday’s meeting will result in holding rates at their current 4.25% to 4.5% level.
The CME FED FUNDS indicator, which gauges the implied forecast of fixed income markets, implies it is almost a certainty that rates are going to be held steady this week.
However, while the FOMC is watching the impact of tariffs closely and incoming data, the nexus of a protracted and expanding conflict in the Middle East could impact the path for interest rates for the remainder of 2025.
The summary of a recent meeting between FED chief Jerome Powell and President Trump also suggests the President is still looking for lower interest rates, but Mr. Powell has no interest in accommodating that if the economic outlook does not support it.
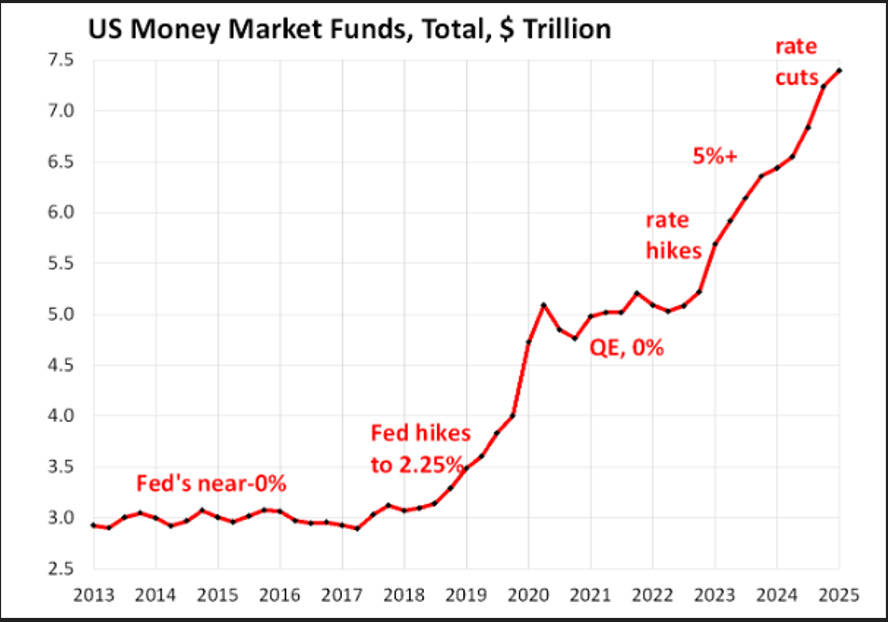
Some of the indicators that we follow suggest that an easing of the FED FUNDS rate could be closer than the market is currently expecting.
As illustrated on Chart 1, aggregate US Money Market funds on deposit are now close to $7.5 trillion. This is a level at which the FOMC has eased rates in the past to reduce funds on deposit and return the funds to the economy.
On the other side of the ledger, Chart 2 shows the percent of balances 90+ days overdue for various types of loans.
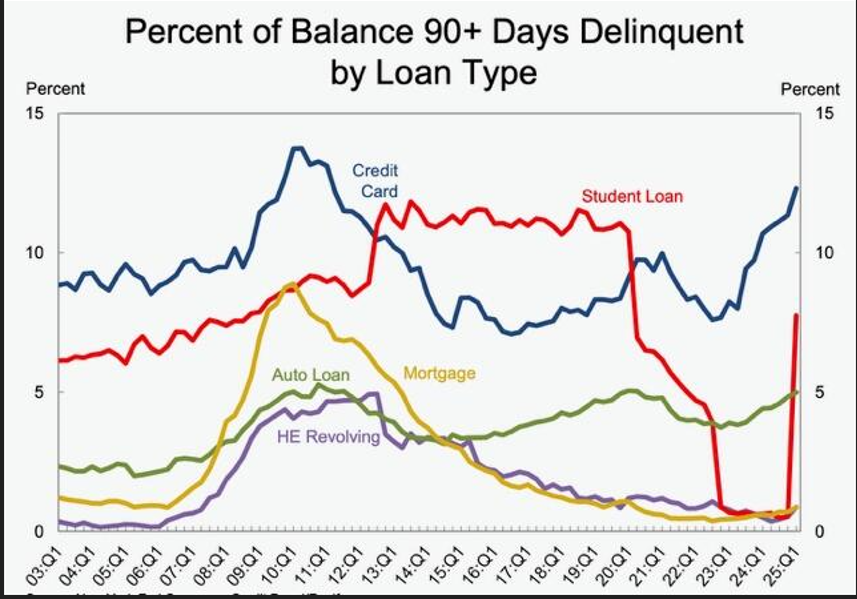
It is important to point out that each of these loan types has outstanding balances of over $1 trillion, including the unsecured student loan debt of over $1.7 trillion.
The FOMC may not lower rates this week, but the forward guidance for policy transmission going into the second half of the year could be very bullish for the precious metals complex.
As such, whether you’re trying to hedge interest rate risk, default risk, currency risk, equity risk, or geopolitical risk, Gold and Silver have proven to be a very effective and secure store of value for centuries.
Now is the time to consider reviewing the risk profile of your portfolio and adding more physical Gold and Silver as the cornerstone assets to your diversified long-term wealth creation strategy.
Chart 3 Gold AUD
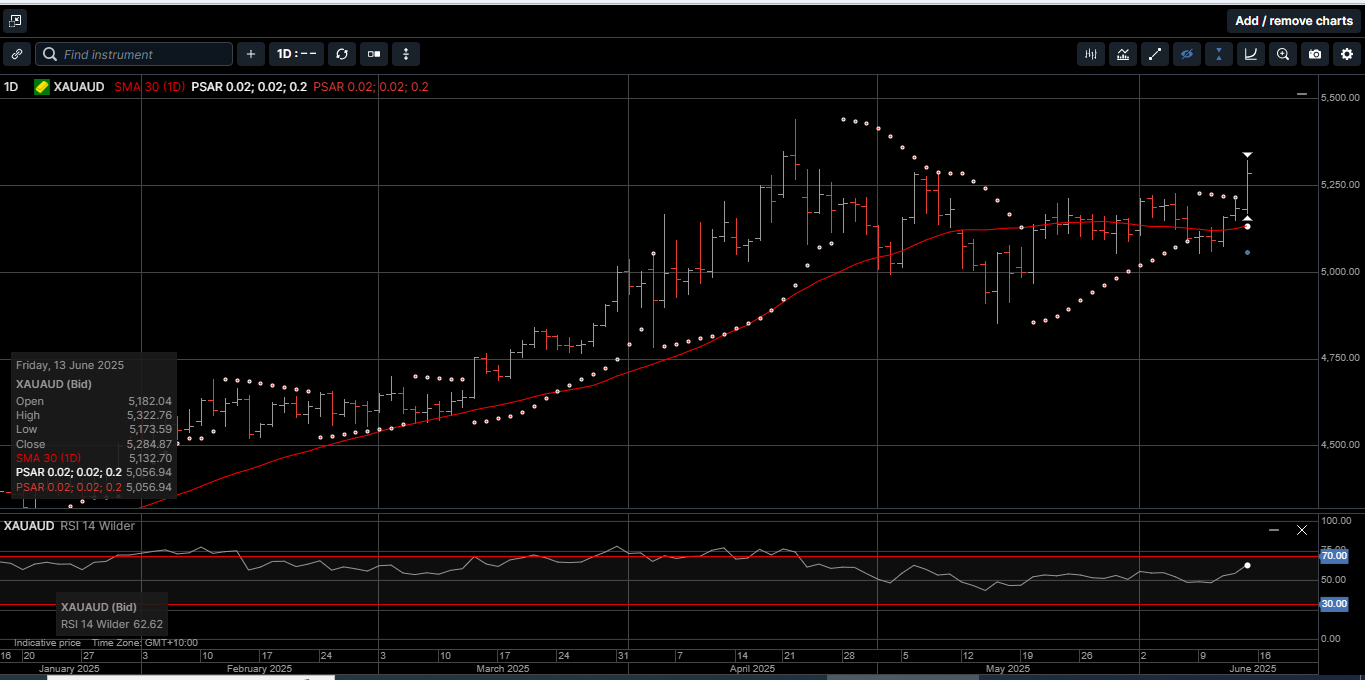
Chart 4 Silver AUD
This publication has been prepared for the GBA Group Companies. It is for education purposes only and should not be considered either general of personal advice. It does not consider any particular person’s investment objectives, financial situation or needs. Accordingly, no recommendation (expressed or implied) or other information contained in this report should be acted upon without the appropriateness of that information having regard to those factors. You should assess whether or not the information contained herein is appropriate to your individual financial circumstances and goals before making an investment decision, or seek the help the of a licensed financial adviser. Performance is historical, performance may vary, past performance is not necessarily indicative of future performance. Any prices, quotes or statistics included have been obtained from sources deemed to be reliable, but we do not guarantee their accuracy or completeness.