Gold and Silver Rally on Rate Cut Expectations
Gold and Silver Rally on Rate Cut Expectations
With respect to US interest rate policy over the next 12 months, it seems clear that the weaker-than-expected US Payroll report released on August 1st was an important turning point.
Just two days prior to the jobs report, the FED held interest rates unchanged citing strength and resilience in the US labor market; a narrative which has been proven incorrect.
The market now recognizes a strong chance of a rate cut next month and at least two before the end of the year, which boosted the precious metals complex last week.
Gold priced in USD tagged the $3400.00 handle for the first time in three weeks, posted a high of $3410.00 and closed 1.0% higher at $3397.00.
Gold denominated in AUD was capped by the 1.0% rally in the AUD/USD but still closed fractionally higher at $5205.00.
Physical Gold priced in both currencies traded higher during six of the last seven trading sessions, which suggests upside price momentum is building.
Physical Silver priced in USD traded higher every day last week on the way to a 2.5% gain and closed back above its 30-Day moving average at $38.32.
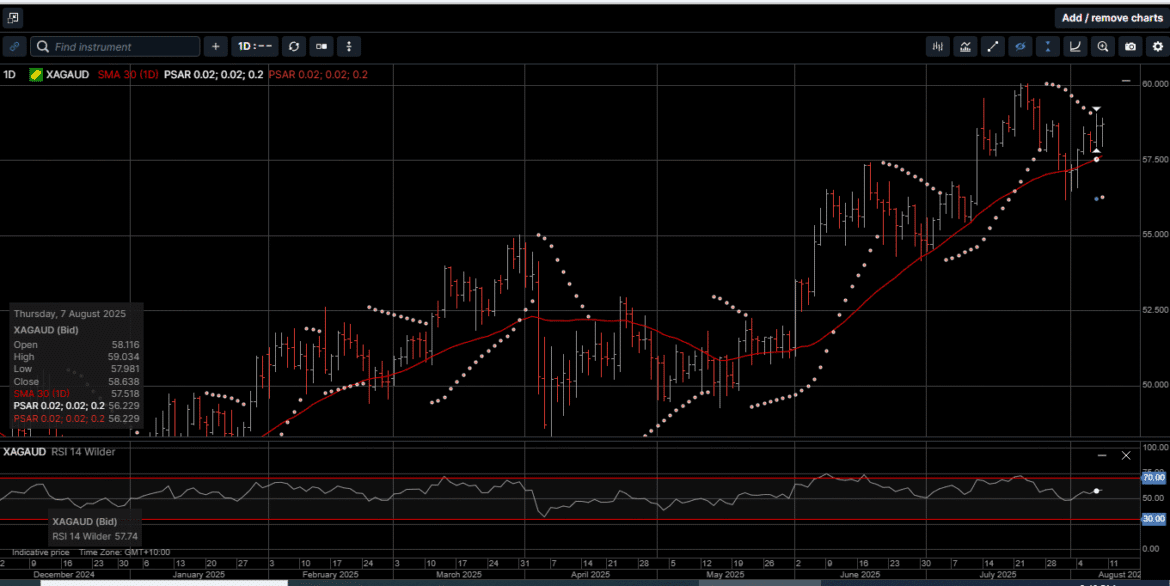
Silver based in AUD followed a similar pattern and closed the week 2.7% higher at $58.70, which is the highest weekly close in four weeks.
The Gold verses Silver ratio moved 2.3% lower in favor of Silver to close at 88.50. This means it takes 88.50 ounces of Silver to equal the price of one ounce of Gold.
After hitting an 18-month low in favor of Silver at 85.70 on July 25th, we saw scope for the current period of consolidation before moving lower in favor of Silver later in the year.
Physical Platinum traded in relatively narrow ranges above the $1300.00 support level and closed out the week up 1.0% at $1341.00.
Whenever market commentators talk about lowering the US Fed Funds rate, the subject of servicing the massive US debt is usually part of the discussion.
Along those lines, when asked how far the US government has plunged into the red, many market participants will tell you the US national debt has reached $37 trillion.
As distressing as that official number is, America’s true fiscal situation is even worse.
According to a barely publicized annual Treasury report, the actual grand total of America’s obligations is more than $140 trillion.
That huge discrepancy is based on the fact that the federal government doesn’t hold itself to the same accounting standards it imposes on businesses and individuals.
Rather than using accrual accounting, which recognizes expenses when they are incurred, the government uses simple cash accounting, only recognizing expenses when they are paid.
As a result, discussions on federal obligations solely focus on the national debt, comprising Treasury bills, notes and bonds.
Once a year, however, a report delivers a more accurate version of the US Treasury’s balance sheet.
This report mandates that it reflects unfunded liabilities, which are commitments made without any dedicated assets or income streams to ensure they will be paid.
By a very wide margin, the largest unfunded liabilities spring from America’s social insurance obligations; primarily Social Security and Medicare.
According to the Treasury’s report, these liabilities totaled an eye-watering $105 trillion.
Stacking these and other unfunded liabilities on top of the publicly held national debt and other obligations, you arrive at a grand total of $143 trillion at the end of the 2024 fiscal year.
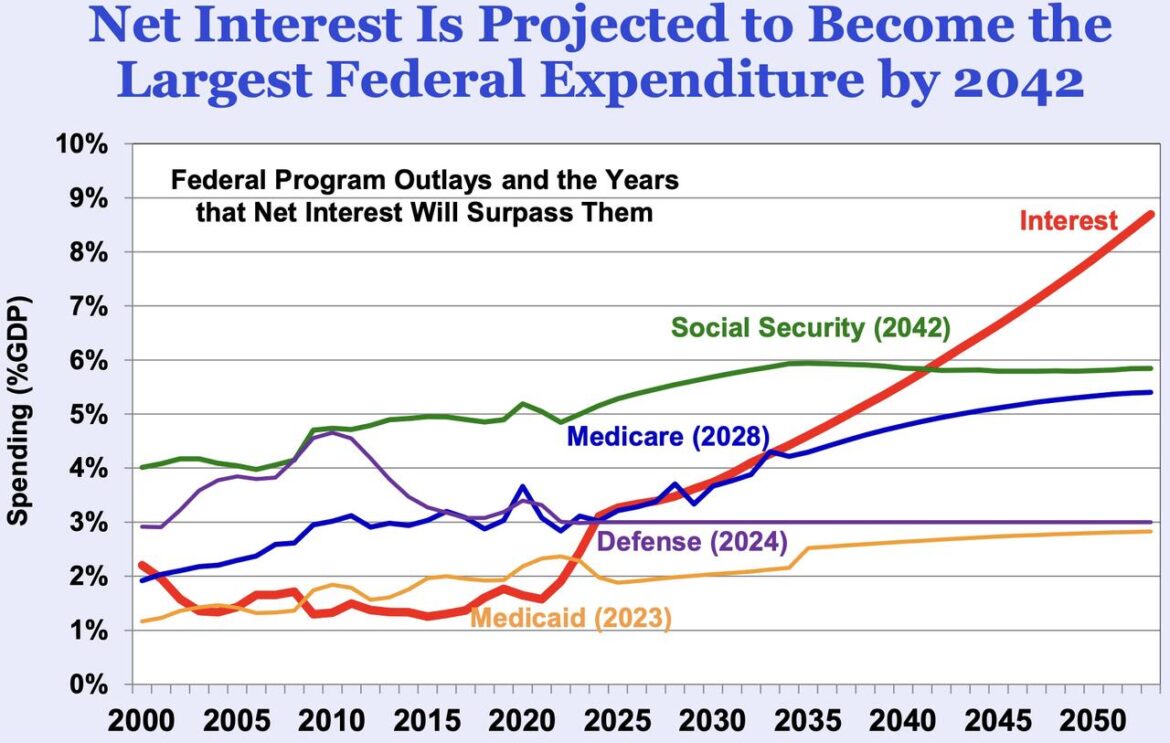
There’s another key component of government spending that isn’t counted in the national debt: interest payments on debt issued to cover past and current spending.
As illustrated on Chart 1, current projections have US debt interest payments surpassing Social Security to become the largest single expenditure by 2042.
Taking these troubling numbers and projections into account, it’s easy to see why the US administration is pushing hard on the FED to recommence the easing cycle which, as shown on Chart 2, started in September of last year.
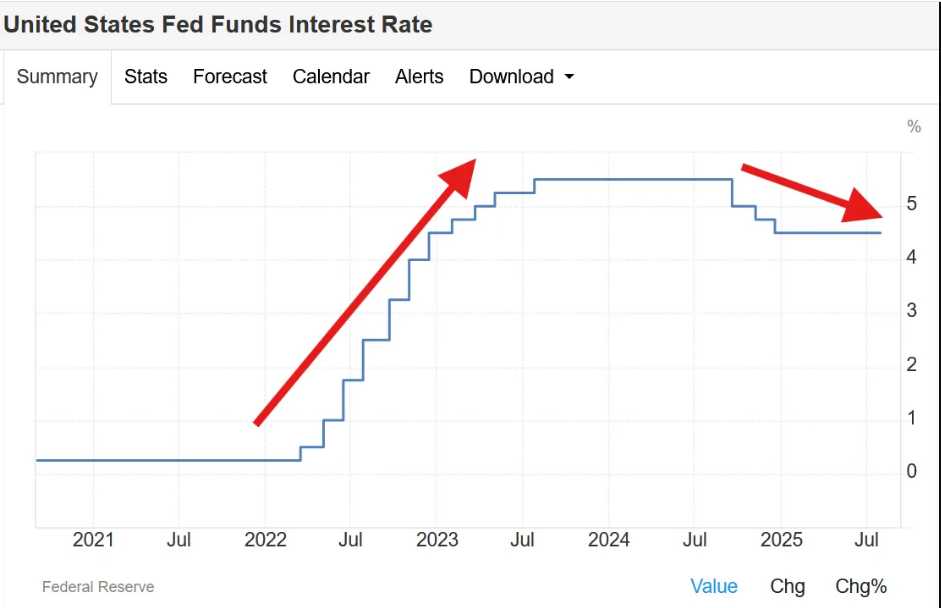
Based on the interest rate tightening cycle that started in 2022, the FED could lower rates by 200 basis points to reach a neutral level for FED Funds at 2.50%
As shown on Chart 3, the expectation for interest rates skewed significantly towards an easing bias after the US payroll report with up to 60 basis points expected this year and up to 75 basis points in 2026.
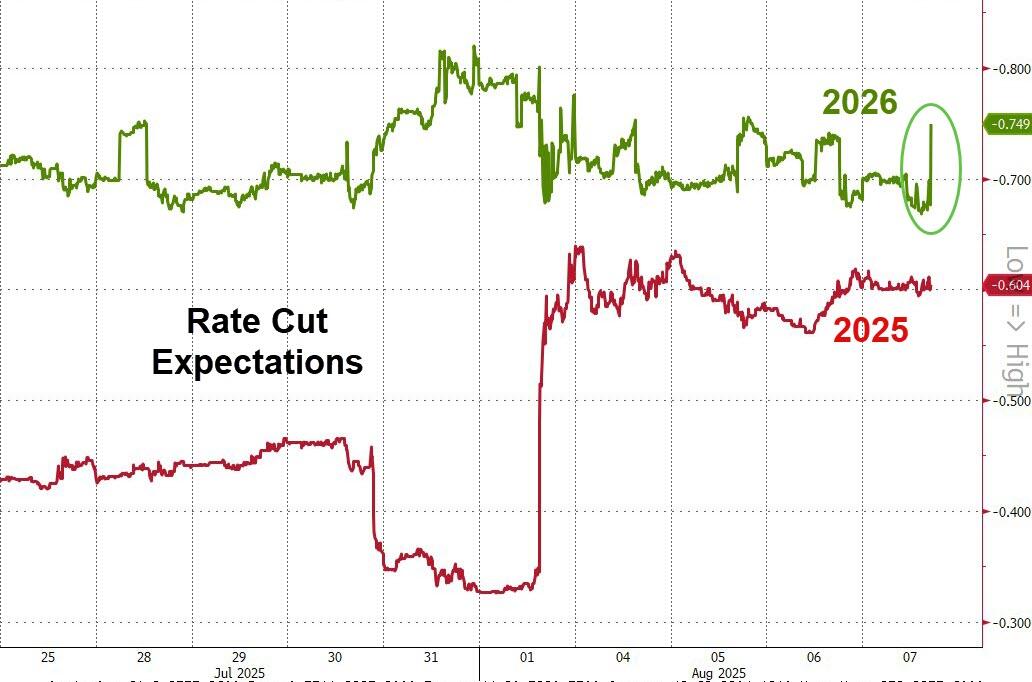
The US fiscal deficits and growing de-dollarization notwithstanding, we expect that an interest rate trajectory of over 100 basis points lower over the next 12 months would be negative for the USD and very bullish for Gold, Silver and Platinum.
As such, investors of all levels of sophistication should think carefully about how exposed their portfolios are to paper assets in an environment of rising deficits and a weaker USD
Gold, Silver and Platinum have been the purest forms of wealth for centuries. They offer stability and diversification for investors looking to build long-term financial security.
Now is the time to consider adding to your physical hard asset holdings as the cornerstone of your wealth creation strategy.
Chart 4 Gold AUD
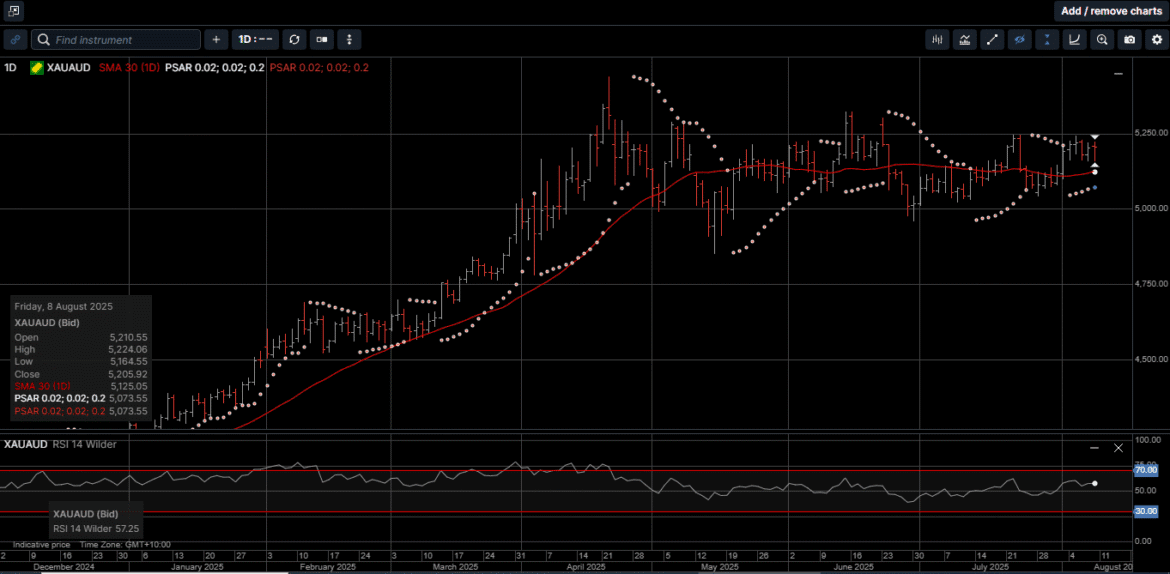
Chart 5 Silver AUD
This publication has been prepared for the GBA Group Companies. It is for education purposes only and should not be considered either general of personal advice. It does not consider any particular person’s investment objectives, financial situation or needs. Accordingly, no recommendation (expressed or implied) or other information contained in this report should be acted upon without the appropriateness of that information having regard to those factors. You should assess whether or not the information contained herein is appropriate to your individual financial circumstances and goals before making an investment decision, or seek the help the of a licensed financial adviser. Performance is historical, performance may vary, past performance is not necessarily indicative of future performance. Any prices, quotes or statistics included have been obtained from sources deemed to be reliable, but we do not guarantee their accuracy or completeness.