Gold and Silver Rally as Credit Stress Goes Global
Gold and Silver Rally as Credit Stress Goes Global
A confluence of unsettling market events last week drew investors back into the safe haven of the precious metals.
These events included the legislative advancement of the US budget reconciliation bill, several surprise trade war announcements from the US administration, rising stress in the US and Japanese bond markets and a broad-based sell-off in the US Dollar.
Physical Gold priced in USD traded higher during four out of the five trading sessions to finish the week 4.8% higher at $3357.00.
Gold denominated in AUD followed a similarly bullish pattern closing at $5165.00 for a weekly gain of 3.4%.
Physical Silver underperformed Gold last week but continues to build upside technical momentum.
Silver priced in USD has found strong support in the $32.00 area and rose 3.71% to close at $33.45.
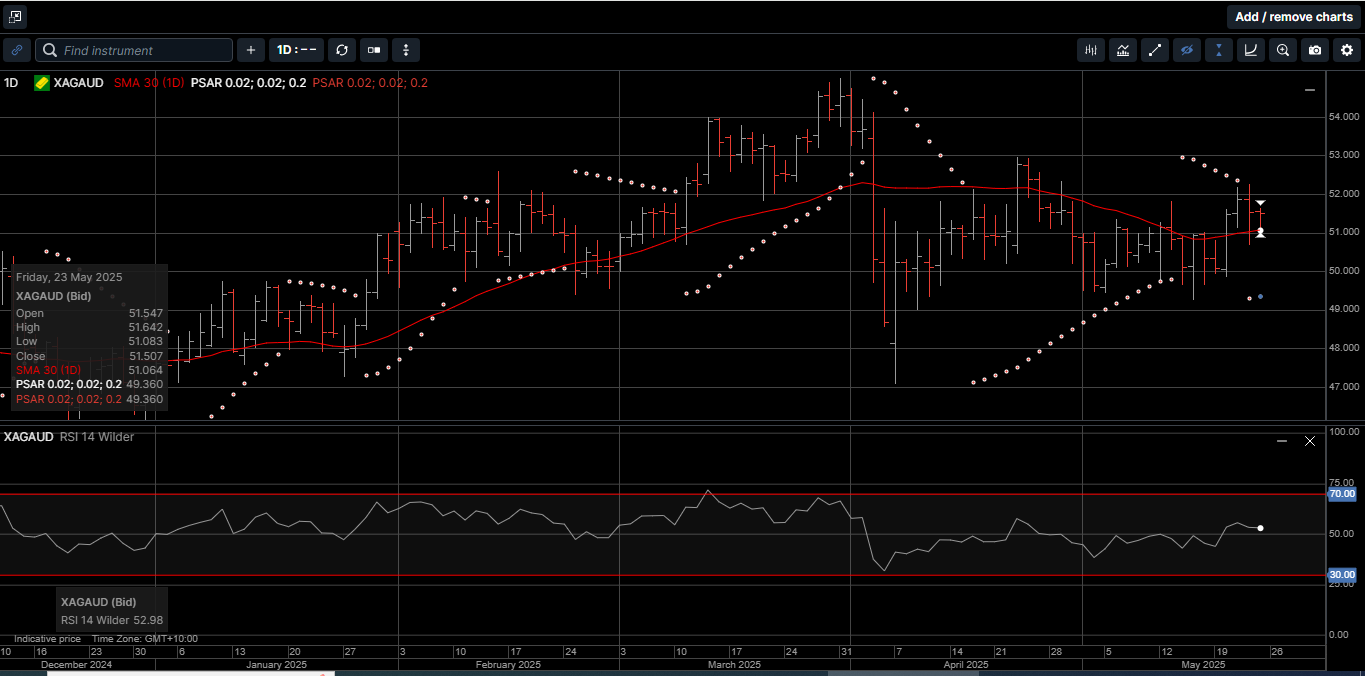
AUD-based Silver gained 2.3% to close at $51.50 and posted its first weekly close above the 30-day moving average since March 28th; which is generally a bullish indicator.
After several weeks of elevated volatility and wide trading ranges, the Gold versus Silver ratio was contained in a relatively narrow range to close at 100.20.
That means it takes 100.20 ounces of Silver to equal the price of one ounce of Gold.
And even though the technical indicators aren’t flashing strong directional signals, we still expect the ratio to revert back to the 80.00 to 90.00 range over the medium term.
It’s not surprising that much of last week’s positive trade flow into Gold and Silver was driven by developments in global debt markets.
According to a report released earlier this month from the Institute of International Finance in Washington D.C., global debt rose by $7.5 trillion in the first quarter of 2025 and now sits at an eye-watering $325 trillion.
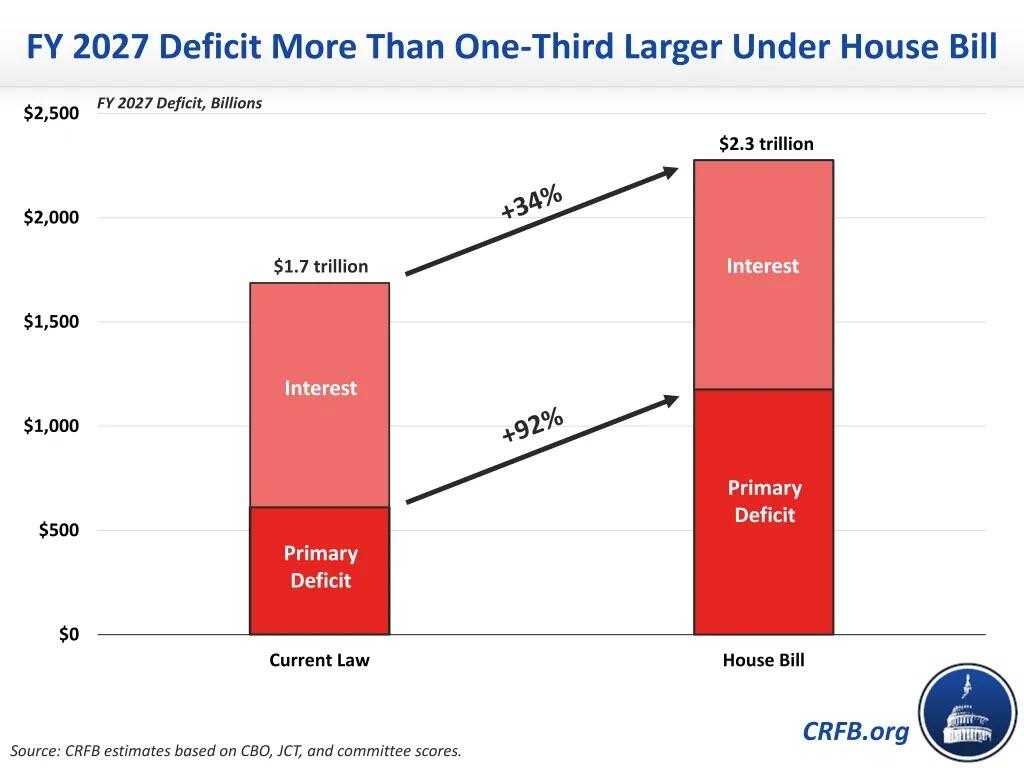
Along those lines, the US Joint Committee on Taxation (JCT) released its preliminary score of the House Ways and Means Committee mark-up of the large budget reconciliation bill approved by the US Congress last Thursday.
The US reconciliation bill is also known as President Trump’s “Big, Beautiful Bill (BBB)”
As illustrated on Chart 1, the JCT estimates that the BBB could add a not so beautiful $600 to $800 billion to the ballooning fiscal year 2027 deficit, which pushed the yield on the benchmark 10-year bond to a three-month high of 4.60%.
At the same time, on the other side of the planet, Japan, which now has substantially more inflation than the US (3.6% overall CPI and 3.2% core CPI) had bond pressures of their own.
Investors watched nervously as its Japanese Government bond (JGB) yields spiked dramatically, while at the same the Bank of Japan has accelerated the Quantitative Tightening operations it started in June of last year.
As shown on Chart 2, the 40-year JGB yield jumped another 11 basis points for a rise of 100 basis points since the beginning of April to 3.56%, and as we know, rising yields means a falling price.
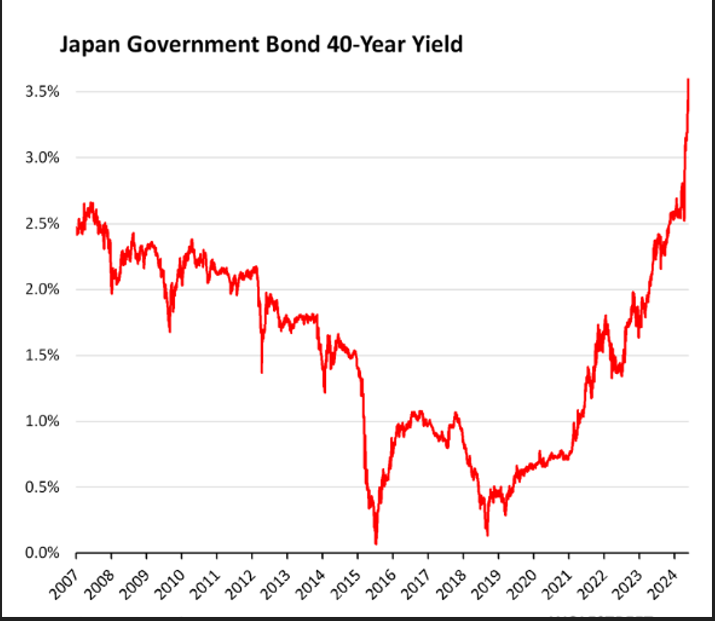
Despite last week’s sharp spike higher, the 40-year yield is still slightly below the rate of Japan’s overall inflation rate, and thereby slightly negative in real terms.
As such, bond holders that bought 40-year bonds a few years ago when the yield was below 1% are getting crushed on price, because a yield spike like this in a very-long-term bond means that the market price of the bond collapses.
If investors don’t want to take the loss selling it, they can hold the bond to maturity, collecting a miserable 0.5% in coupon interest a year for decades, and then finally get paid face value when the bond matures.
Why is this a problem for the US bond market and the US Dollar?
Because the Japanese government and its private investors own trillions of USD worth of foreign-currency denominated securities, including over $1.2 trillion in US Treasury securities that can be sold to prop up their domestic bond market.
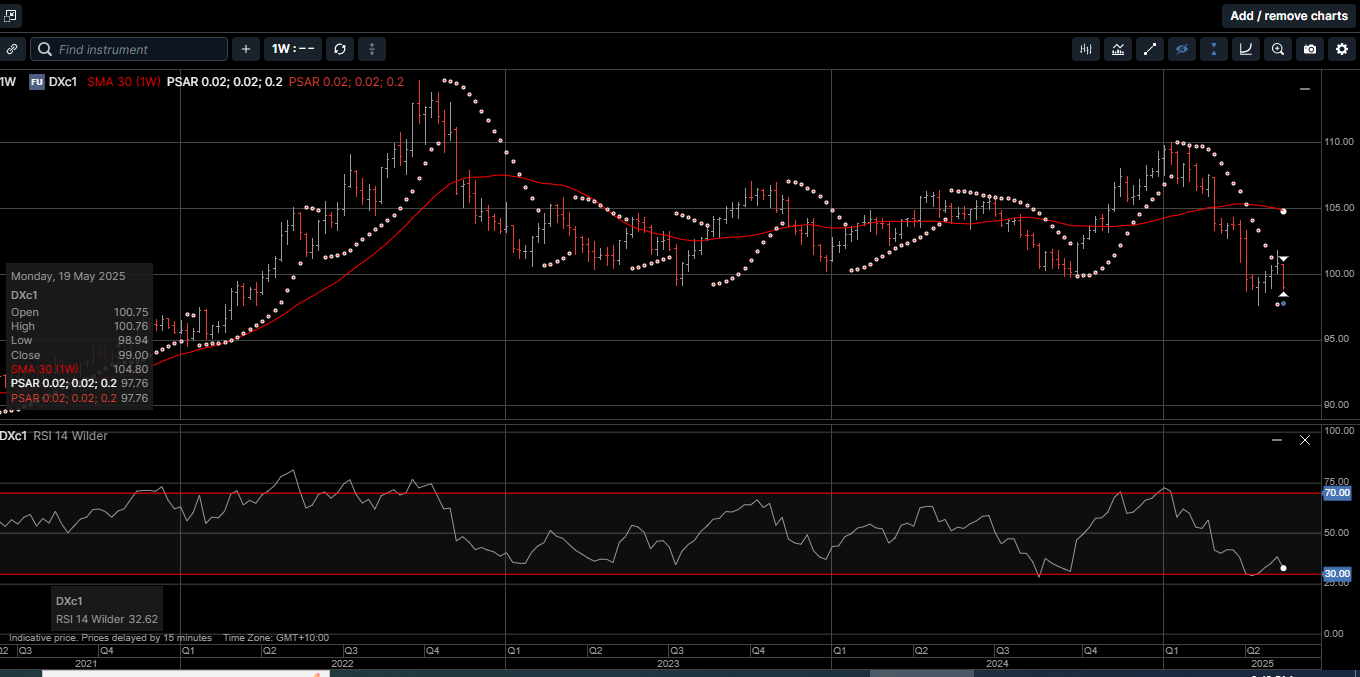
As shown on Chart 3, despite the rising yields across the entire US Treasury curve, the USD Index slipped 2.00% lower last week and has lost over 10.00% since the end of January.
This market dynamic was bullish for Gold and Silver last week and will likely continue to drive prices higher for investors over the longer term.
Gold and Silver have been at the heart of the US monetary system since the nation’s founding, evolving from a direct anchor for the USD to the current role of strategic reserve assets.
And even though Gold and Silver no longer back the USD directly, they remain a cornerstone of central bank reserves, a discreet but powerful hard asset in global finance.
Throughout history, monetary resets have been a recurring theme, and more often than not, they have revolved around Gold and Silver because they represent the purest form of money.
Understanding this history of wealth security isn’t just about the past, it’s also about the future.
And if history is any guide, another reset, perhaps triggered by a systemic credit market shock, may be coming sooner than most expect.
Whether you’re hedging against inflation, a weaker USD, or growing global uncertainty, Gold and Silver offer time proven protection you can hold and store as part of a diversified wealth creation strategy.
Now is the time to consider increasing the amount of physical Gold and Silver within your long term portfolio.
Chart 4 Gold AUD
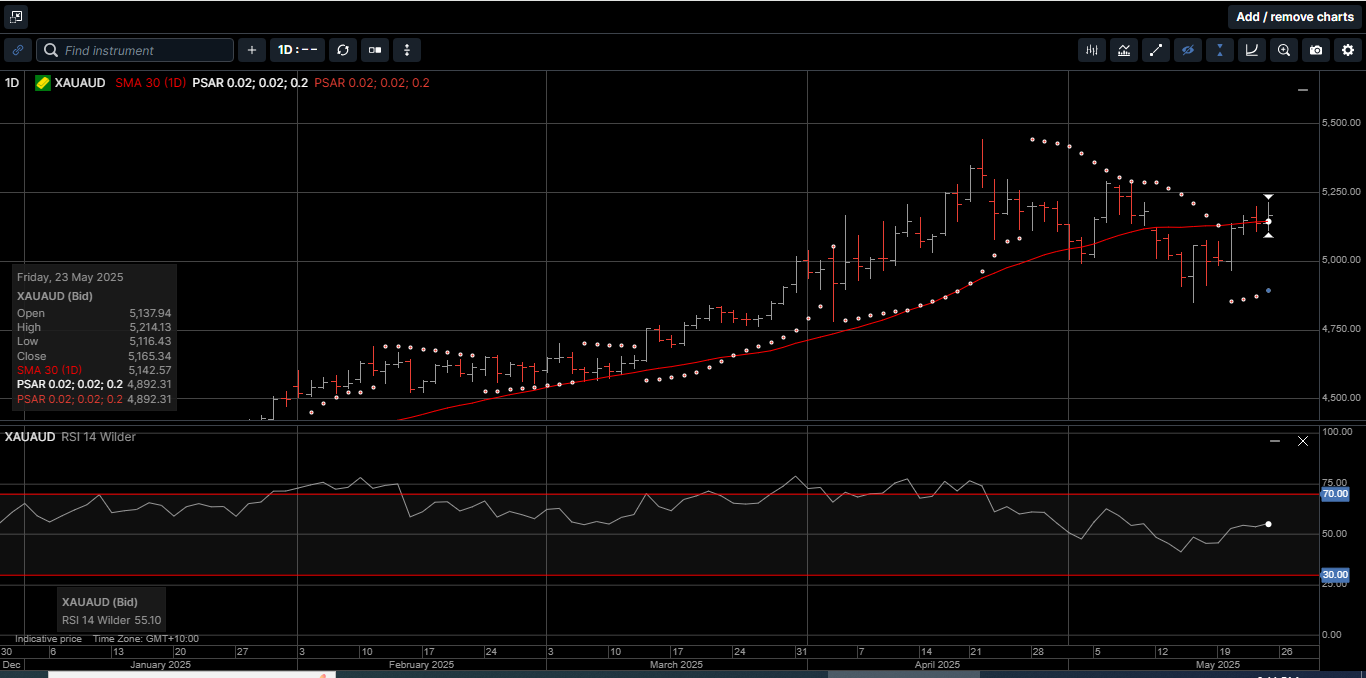
Chart 5 Silver AUD
This publication has been prepared for the GBA Group Companies. It is for education purposes only and should not be considered either general of personal advice. It does not consider any particular person’s investment objectives, financial situation or needs. Accordingly, no recommendation (expressed or implied) or other information contained in this report should be acted upon without the appropriateness of that information having regard to those factors. You should assess whether or not the information contained herein is appropriate to your individual financial circumstances and goals before making an investment decision, or seek the help the of a licensed financial adviser. Performance is historical, performance may vary, past performance is not necessarily indicative of future performance. Any prices, quotes or statistics included have been obtained from sources deemed to be reliable, but we do not guarantee their accuracy or completeness.