Gold and Silver Enter the Accumulation Zone
Gold and Silver Enter the Accumulation Zone
If one word could characterize the current global business climate, it would be uncertainty.
The steady flow of tariff news, policy reversals, and ongoing geopolitical tensions has perplexed businesses and investors alike, which has kept physical Gold and Silver prices well supported albeit within broad trading ranges.
Gold priced in USD traded on both sides of the 30-Day Moving Average (30 DMA) at $3302.00 every day last week and closed 1.9% lower at $3289.00.
Gold denominated in AUD has traded on both sides of its 30 DMA at $5138.00 for the last nine consecutive sessions and slipped 1.1% lower to close at $5108.00
Physical Silver prices outperformed Gold to a small degree within narrow ranges.
Silver priced in USD spent every trading session last week above its 30 DMA at $32.85 but slid 1.5% lower into the weekend to close at $32.98.
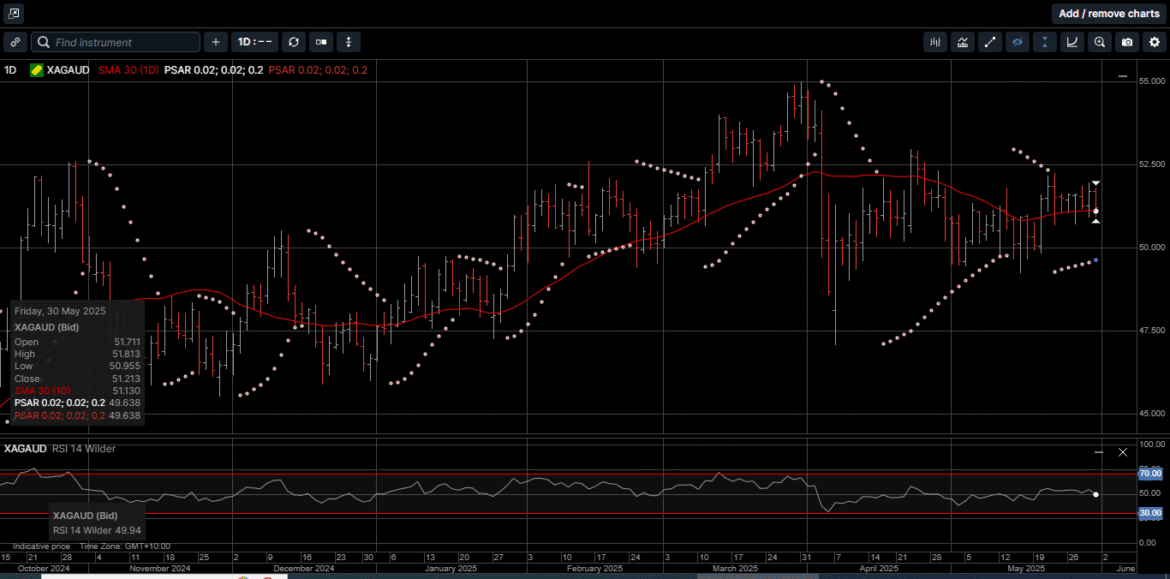
AUD-based Silver followed a similar pattern holding above its 30 DMA at $51.13 but finished the week fractionally lower at $51.21.
We reference the 30 DMA because it’s a widely used, simple momentum indicator: prices above the average suggest a higher trend and vice versa.
Prices trading on both sides of the 30 DMA for an extended period of time is directionally neutral from a technical perspective.
However, considering that both Gold and Silver prices have had protracted rallies over the last 12 months, this neutral chart pattern is more likely a pause before trading higher, as opposed to a change in trend.
As such, Gold and Silver are in the accumulation zone.
The Gold versus Silver ratio traded in a relatively narrow range last week and closed slightly in the favor of Silver at 99.65. That means it takes 99.65 ounces of Silver to equal the price of one ounce of Gold.
With the level of market uncertainty on the rise, some analysts are suggesting moving away from the typical 60/40 equity-bonds portfolio mix and allocating more into Silver and Gold.
This is not a short-term trade idea, nor is it one of those macro trades the market has seen so much of these past three years.
This is a call to change how pension managers and the largest institutions could allocate big money to hedge equity market risk.
As illustrated on Chart 1, sovereign entities like Central Banks started replacing Bonds with Gold as early as 2014 and began doing so more aggressively in 2022.
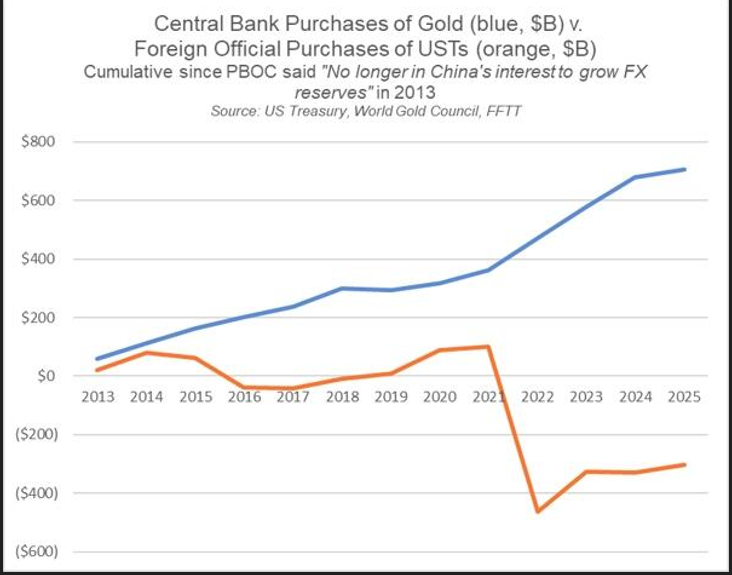
Now, privately held institutions and individuals have begun following the Central Banks’ lead.
Despite reports that show the record pace of Central Bank Gold acquisition over the last three years, many investors are still underweight both Gold and Silver compared to stocks and bonds.
As shown on Chart 2, Gold Exchange Traded Funds (ETFs) represent only 1.8% of the entire market capitalization of listed ETFs.
It is our view that Chart 2 serves as a reminder of how far Gold and Silver have to go in terms of broadening investment interest for investors with a long-term time horizon.
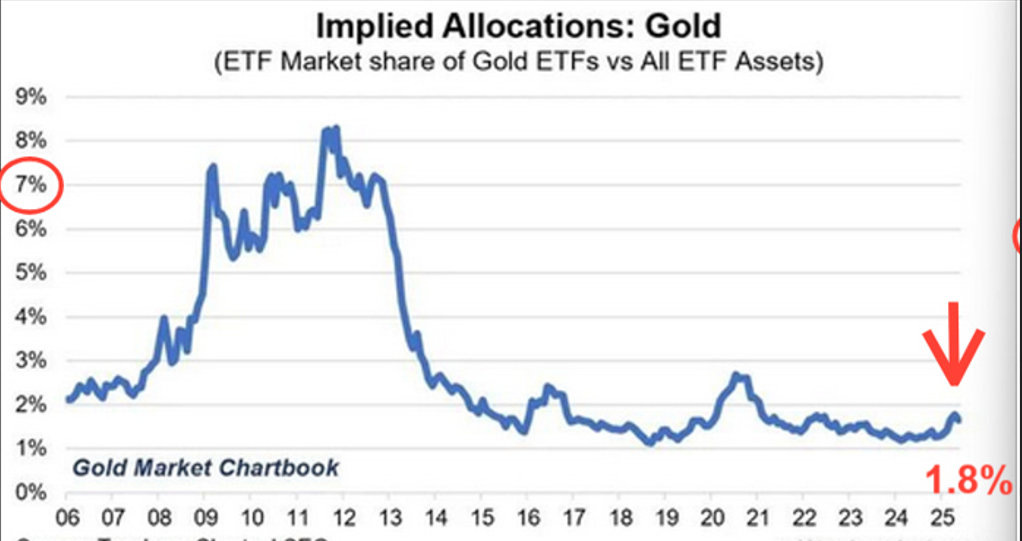
In other words, there is significant upside to go in restoring Gold and Silver as proper assets for global financial health.
When stocks and bonds stop working, the typical portfolio model should change.
The traditional 60/40 equity-bond allocation mix failed twice in recent month; once during tariff-induced recession fears in early April, and again as long-term borrowing costs surged on fiscal sustainability concerns in Mid-May.
In both cases, U.S. Treasury bonds failed to offset the Wall Street equity drawdowns.
The failure of bonds to provide protection has triggered a rethink of how real assets are integrated into long-term wealth creation portfolios.
The 60/40 construct assumes that equity and bond risks are negatively correlated particularly during downturns. However, in an era where inflation shocks are increasingly tied to fiscal overreach and geopolitical instability, this assumption no longer holds.
The 1970s featured runaway inflation fueled by fiscal expansion and energy disruption. The 2000s saw monetary excess and commodity spikes.
And most recently, 2022 brought policy whiplash from COVID stimulus, colliding with supply-side dislocations following the beginning of the Ukraine/Russia war.
In each instance, traditional assets failed simultaneously while Gold and Silver maintained their safe haven store of value.
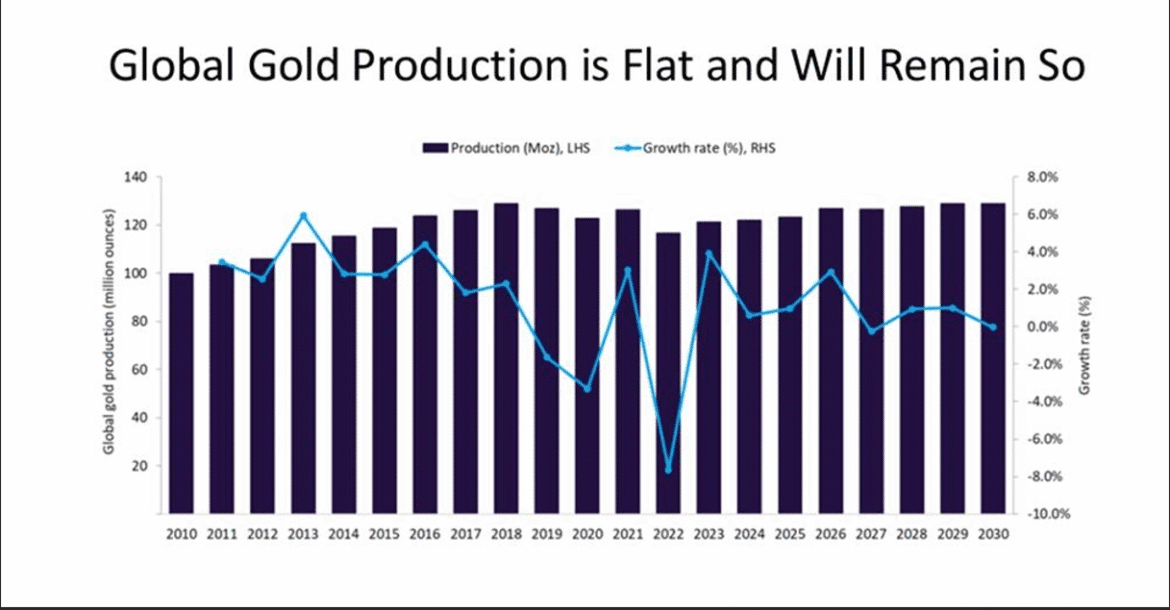
Against this backdrop, as shown on Chart 3, Gold production is expected to remain flat for the next five years.
Taking into account the recent pullback from the all-time highs in April, USD Gold is up 25.3% on a year-to-date basis. AUD Gold is up 20.5%, while Silver in USD and AUD terms are up 14.2% and 9.7%, respectively.
Compare these results to the SP 500, which is down 0.5% and NASDAQ, which is fractionally higher for the year.
For provident investors, Gold and Silver prices are currently in the accumulation zone.
Now is the time to consider re-allocating assets from the paper sphere into the time proven security of physical Gold and Silver as part of a diversified, long-term wealth creation strategy.
Chart 4 Gold AUD
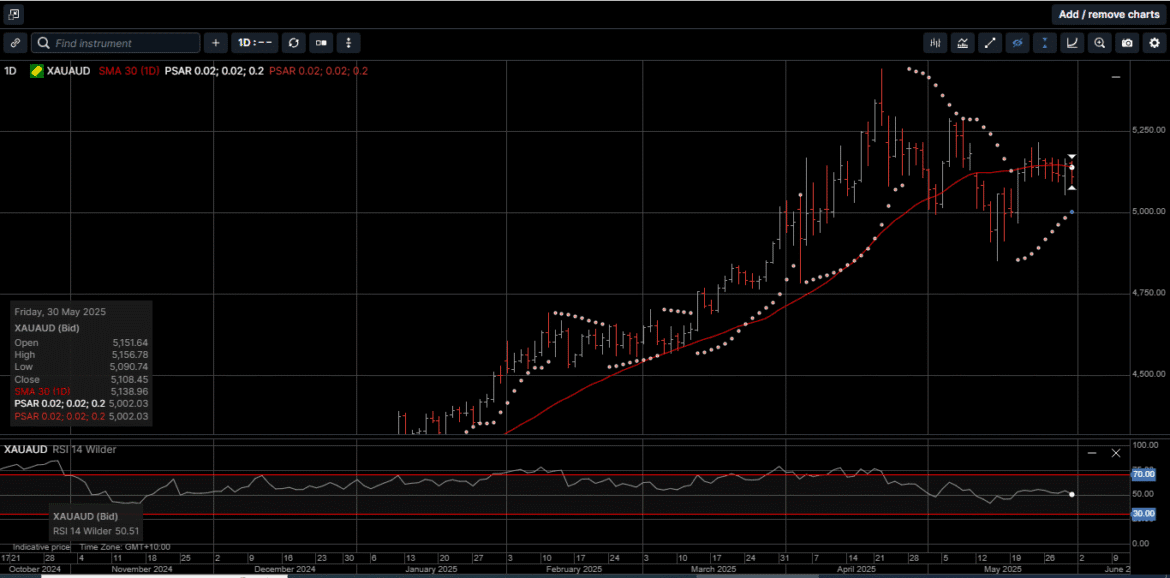
Chart 5 Silver AUD
This publication has been prepared for the GBA Group Companies. It is for education purposes only and should not be considered either general of personal advice. It does not consider any particular person’s investment objectives, financial situation or needs. Accordingly, no recommendation (expressed or implied) or other information contained in this report should be acted upon without the appropriateness of that information having regard to those factors. You should assess whether or not the information contained herein is appropriate to your individual financial circumstances and goals before making an investment decision or seek the help the of a licensed financial adviser. Performance is historical, performance may vary, past performance is not necessarily indicative of future performance. Any prices, quotes or statistics included have been obtained from sources deemed to be reliable, but we do not guarantee their accuracy or completeness.