Buy the Dip in Gold and Silver?
Trading in the precious metals complex continues to be headline driven with wide intraday trading ranges and largely inconsistent market correlations.
Against a backdrop of neutral interest rates and the USD sliding to a 10-month low last week, Gold and Silver prices would typically trade higher.
However, both Gold and Silver took a step back last week as signs of easing trade tensions saw investors take profits in the safe haven metals after last month’s strong rally.
Physical Gold priced in USD slipped 2.3% lower to close at $3240.00, well above the 30-day moving average support level at $3185.00.
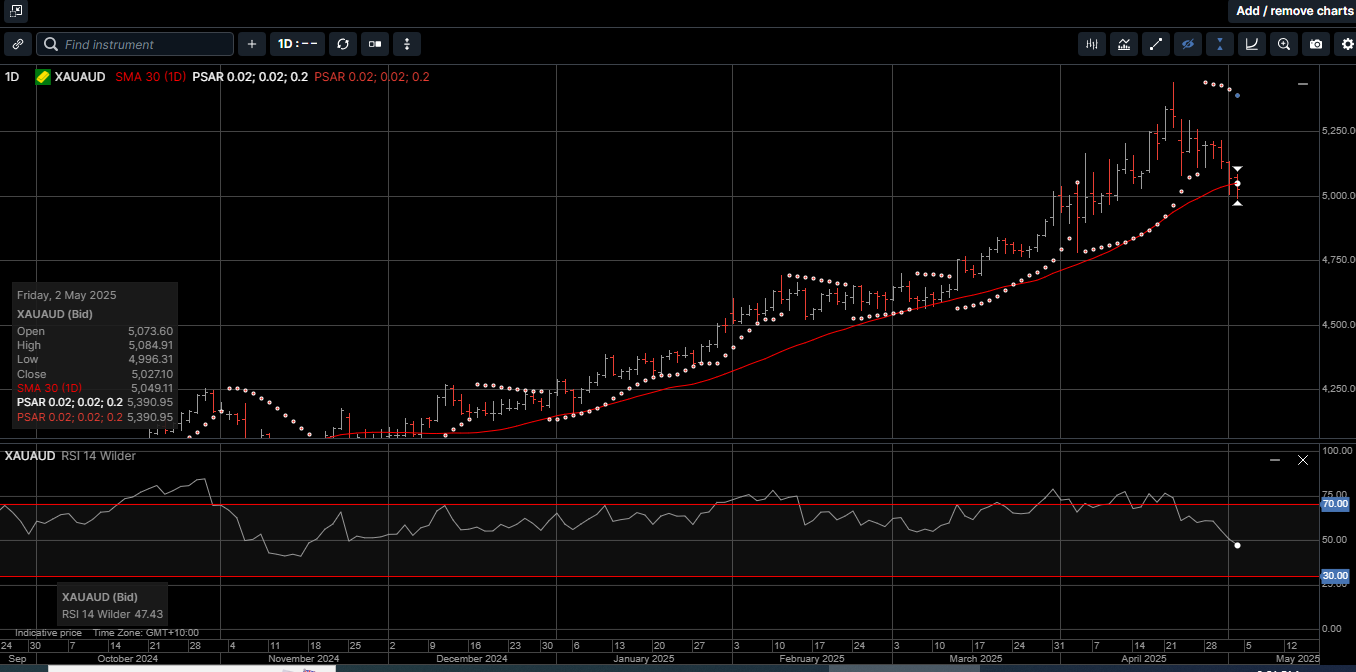
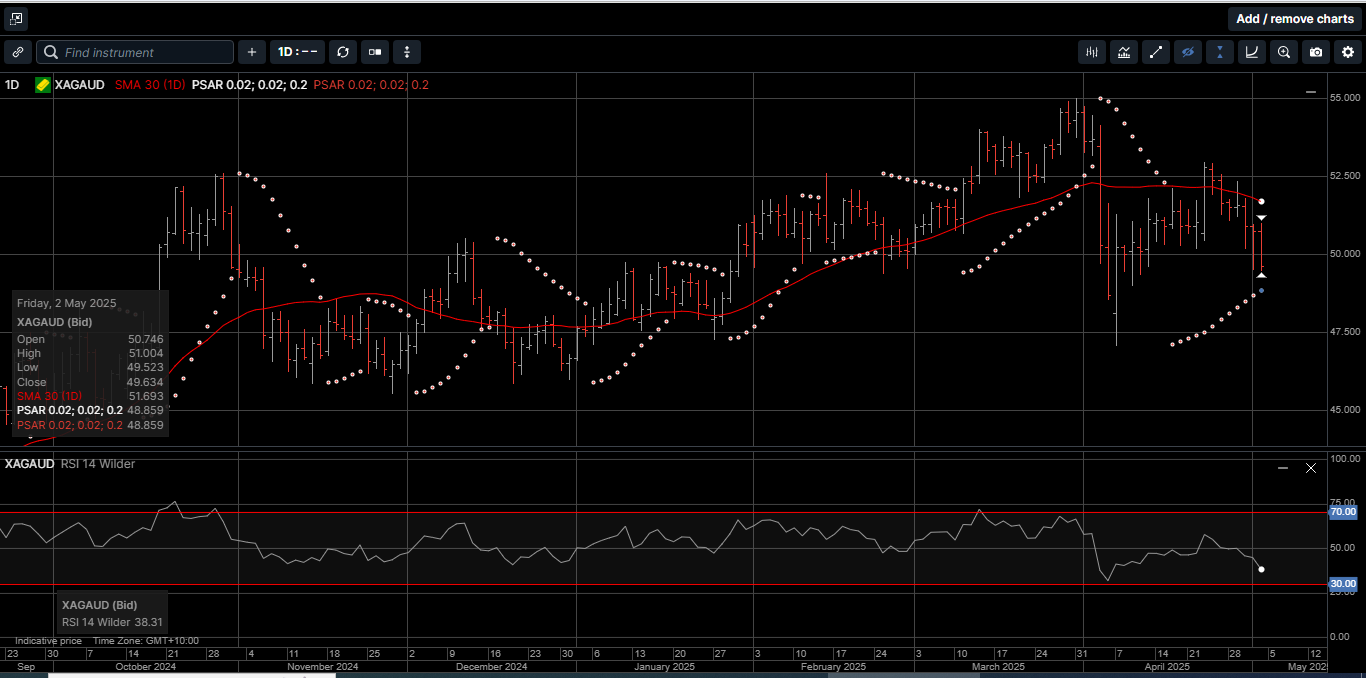
Gold denominated in AUD dropped 2.9% and finished the week at $5027.00, which is the first daily close below the 30-day moving average since December 5th.
Physical Silver priced in USD gave up the previous week’s gains to settle 3.3% lower at $32.05, while Silver based in AUD fell 3.9% to close out the week just below $50.00.
The relative underperformance from Silver last week saw the Gold versus Silver ratio remain in an elevated consolidation pattern and settle at 101.20.
This means it takes 101.20 ounces of Silver to equal the price of one ounce of Gold.
Even though physical Gold prices have traded lower over the last two weeks, we believe it’s reasonable to expect both Gold and Silver to post better returns than most other asset classes in 2025.
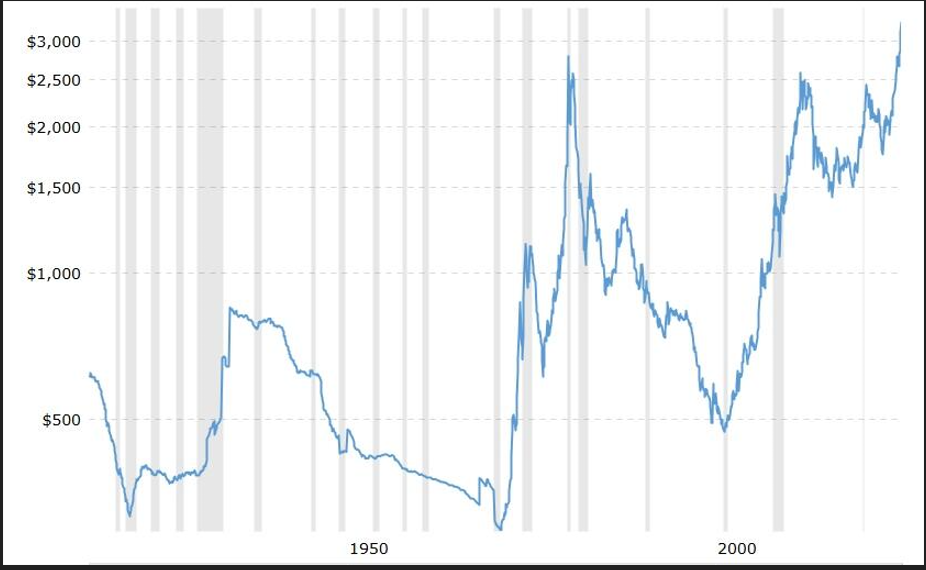
As illustrated on Chart 1, the long-term bullish price pattern dating back to 1971 suggests the current trend has considerably more upside potential over the next several years.
This dynamic is supported by Chart 2, which shows that central banks have been net buyers of physical Gold since 2008.
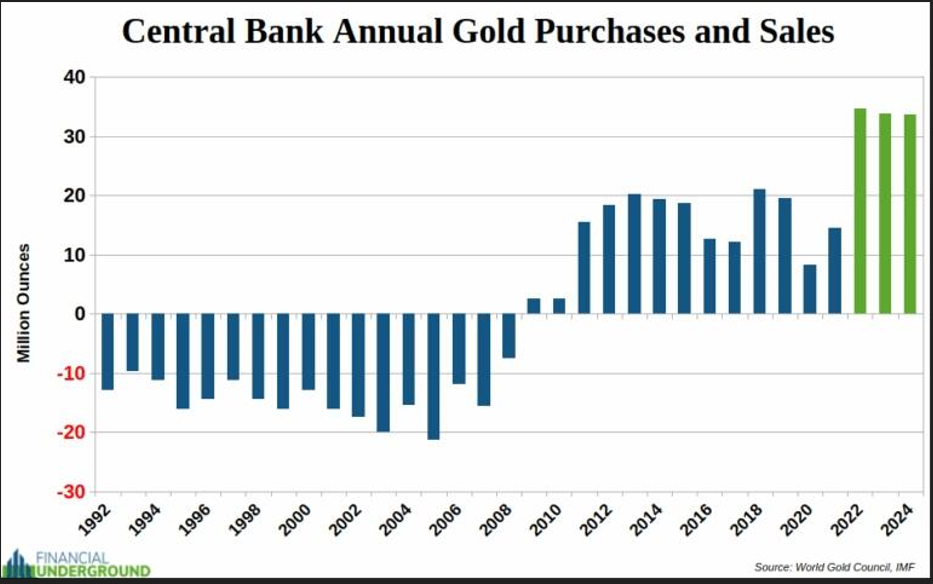
Last year, central banks purchased approximately 34 million ounces of Gold, marking the third consecutive year of near-record buying.
The market is experiencing the acceleration of a long-term trend that began around the 2008 financial crisis, when central banks shifted from net sellers to net buyers of Gold.
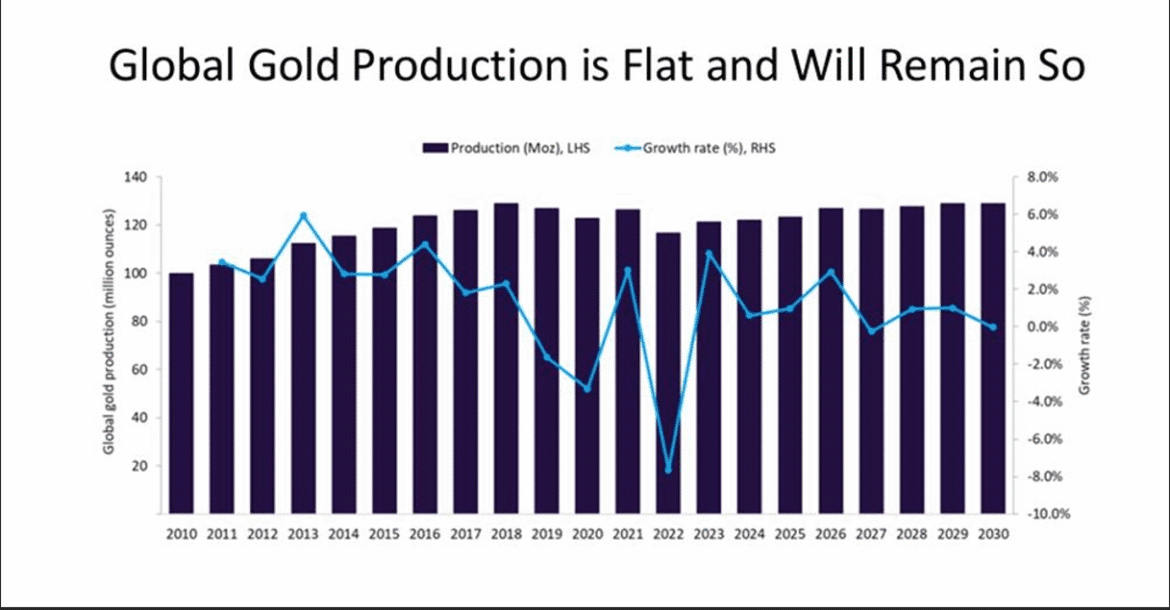
That trend has exploded in recent years, with Gold purchases surging to record-breaking levels while, as shown on Chart 3, global Gold production has remained materially flat.
All fundamental signs suggest that 2025 will be another massive year for central bank Gold buying.
Central banks and governments are the largest single holders of Gold on the planet.
In aggregate, they officially own over 1.2 billion troy ounces out of the seven billion ounces humans have mined throughout history.
However, these are just the official numbers that governments report.
The actual Gold holdings could be much higher, as governments often tend to be reticent about their reserves, treating the yellow metal as a strategic financial asset.
According to the World Gold Council, Russia and China have been the biggest Gold buyers over the last two decades.
It seems like the trend of central bank Gold accumulation is gaining momentum. And that is not surprising.
The vectors of uncertainty are everywhere.
These include trade tariffs, the war in Ukraine, BRICS de-Dollarization, tensions in the Middle East, a global recession risk, and rising civil unrest in China among others.
It’s difficult to forecast how any one of these situations will turn out, let alone all of them and their potentially complex interactions.
Stocks and bonds can be volatile as a result of this uncertainty.
Physical Gold and Silver are safe haven assets that have represented a store of value for centuries and offer investors peace of mind and security during uncertain economic times.
Gold and Silver are truly the everything hedge.
These drivers are sending Gold and Silver prices higher and could put a floor under current price levels so that investors can enjoy potential upside with reduced concern about a protracted downside.
That’s what is called an asymmetric trade, which greatly favours investors with a longer-term time horizon.
We believe the recent pullback in Gold and Silver prices represents an opportunity to add to your current hard asset holdings before the next leg higher in prices.
At current prices, provident investors should consider the time proven monetary benefits of owning Gold and Silver as a cornerstone asset within a diversified portfolio.
This publication has been prepared for the GBA Group Companies. It is for education purposes only and should not be considered either general of personal advice. It does not consider any particular person’s investment objectives, financial situation or needs. Accordingly, no recommendation (expressed or implied) or other information contained in this report should be acted upon without the appropriateness of that information having regard to those factors. You should assess whether or not the information contained herein is appropriate to your individual financial circumstances and goals before making an investment decision, or seek the help the of a licensed financial adviser. Performance is historical, performance may vary, past performance is not necessarily indicative of future performance. Any prices, quotes or statistics included have been obtained from sources deemed to be reliable, but we do not guarantee their accuracy or completeness.