A Solid Year for Hard Assets
The last two weeks have seen a recurring pattern in the precious metals complex. This is a pattern of higher prices early in the week, followed by a reversion lower into the weekend.
And while the net change over the last two weeks has been relatively flat, the technical indicators continue to build upside momentum suggesting higher prices for Gold, Silver and Platinum during the second half of 2025.
Gold priced in USD posted a four-week high at $3440.00 on Wednesday and then slipped lower to finish the week fractionally lower at $3350.00.
Gold denominated in AUD reached a three-week high at $5245.00 during mid-week trade before falling 1.2% to close at $5140.
Physical Gold in both currencies are in a Pennant chart pattern with the inflection points for higher prices at $3450.00 and $5290.00, respectively.
Silver priced in USD tagged a 14-year high at $39.52 before selling pressure drove prices back to unchanged for the week at $38.20.
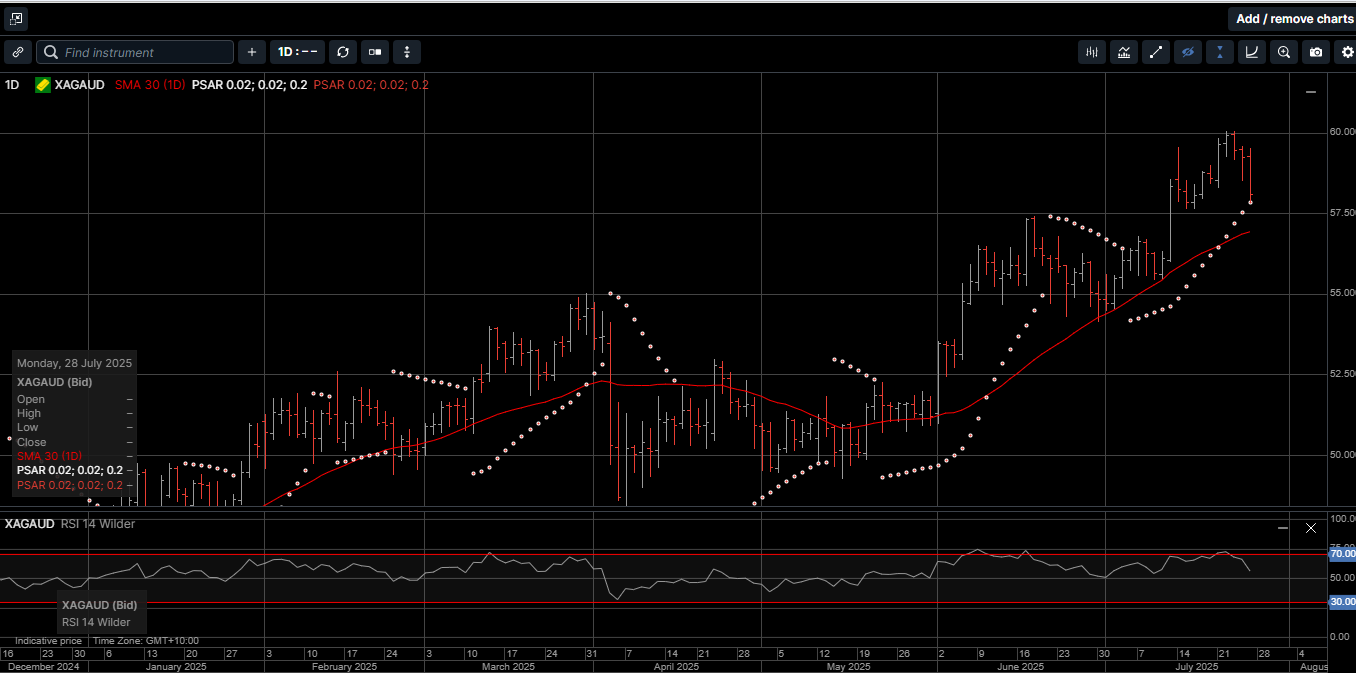
Silver denominated in AUD reached a new all-time high at $60.00 on Wednesday but was unable to hold on to the gains and closed out the week half a percent lower at $58.10.
The Gold versus Silver ratio traded within recent ranges last week and closed at 87.30. That means it takes 87.30 ounces of Silver to equal the price of one ounce of Gold.
Over the longer term, we expect the Gold versus Silver ratio to slide lower and eventually back into the 70.00 handle.
On a year-to-date basis, USD Gold has risen by 27.6%, while USD Silver is currently 32.2% higher than at the beginning of the year.
AUD based Gold and Silver have a year-to-date return of 21.3% and 24.5%, respectively.
As impressive as those returns have been, the price of Platinum has performed even better for hard asset investors
As illustrated on Chart 1, after 10 years of trading within a broad price range, Platinum has broken out higher with an eye-watering 67% surge over the past seven months.
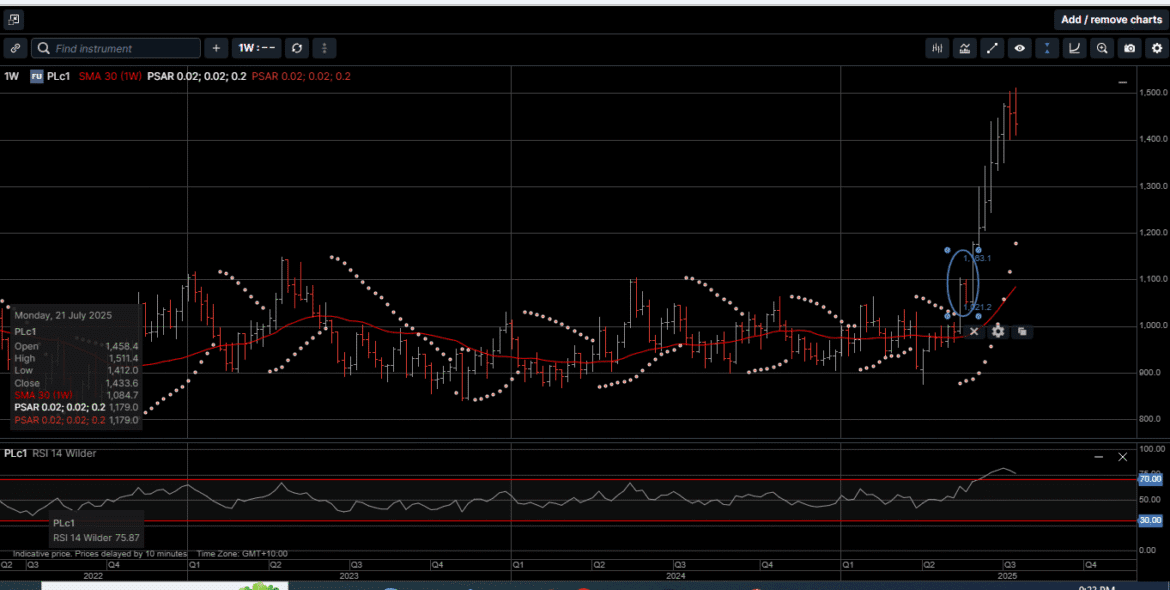
And considering that the all-time high price for physical Platinum was posted in March of 2008 at $2290.00, this rally could extend another 60% before challenging a new all-time high.
Platinum is one of the rarest elements in earth’s crust; about 30 times rarer than Gold. Further, 90% of global production comes from a handful of nations like Russia, Canada, and South Africa, which holds the largest reserves.
Unlike Gold and Silver, which have long histories as monetary metals used in coinage, currency backing, and investment, Platinum has played virtually no role as sovereign money.
In fact, only about 8% of its current demand comes from investment with the remaining 92% driven by other applications including automotive catalytic converters, industrial uses, and jewelry.
One of the primary drivers behind the recent surge in Platinum prices is the significant decline in supply from both mining and recycling.
As shown on Chart 2, the physical Platinum supply has dropped by approximately 1.3 million troy ounces, or roughly 16%, since its 2021 peak.
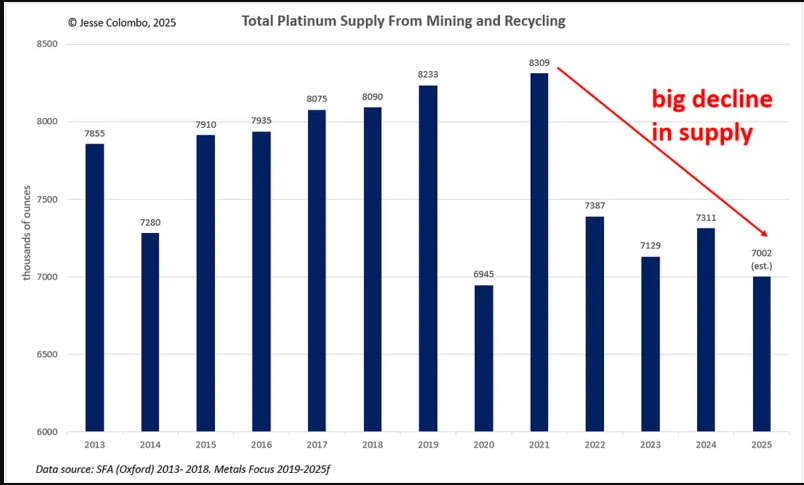
In South Africa, the leading producer, persistent electricity shortages, labor strikes, escalating operational costs, and inconsistent investment in new mines have caused supply disruptions.
While the global supply of Platinum has declined over the past five years, as shown on Chart 3, demand has remained robust, even amidst concerns about reduced need for platinum in automotive catalytic converters due to the rising popularity of electric vehicles.
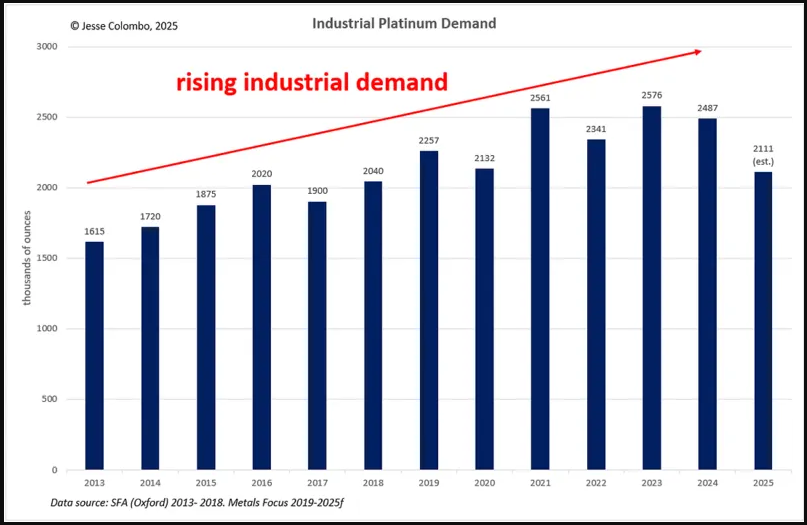
The shrinking supply of Platinum, coupled with sustained demand, has driven the platinum market into a deficit of nearly 1 million ounces over the past two years, with a similar shortfall anticipated for 2025.
This deficit in Platinum is similar to the deficit in physical Silver.
The growing recognition that the deficits in both metals are unlikely to improve soon has been an important catalyst for Platinum’s surge over the past seven months, and Silver’s steady rally over the past 18 months.
Along these lines, investors with a longer-term time horizon looking for the security and liquidity of hard assets can take a diversified approach by allocating funds to physical Gold, Silver and Platinum.
From a wider perspective, many stock indexes are now trading at or near their all-time highs. The longer these indexes probe new high territory, the greater the risk of a substantial repricing of paper assets lower.
With the fundamental drivers of the precious metals complex still underpinning higher prices over the medium term, now is the time to consider a portfolio analysis to lighten up on overpriced or underperforming assets.
On a year-to-date basis, there are few investment options that have boosted wealth creation strategies greater than Gold, Silver and Platinum.
Chart 4 Gold AUD
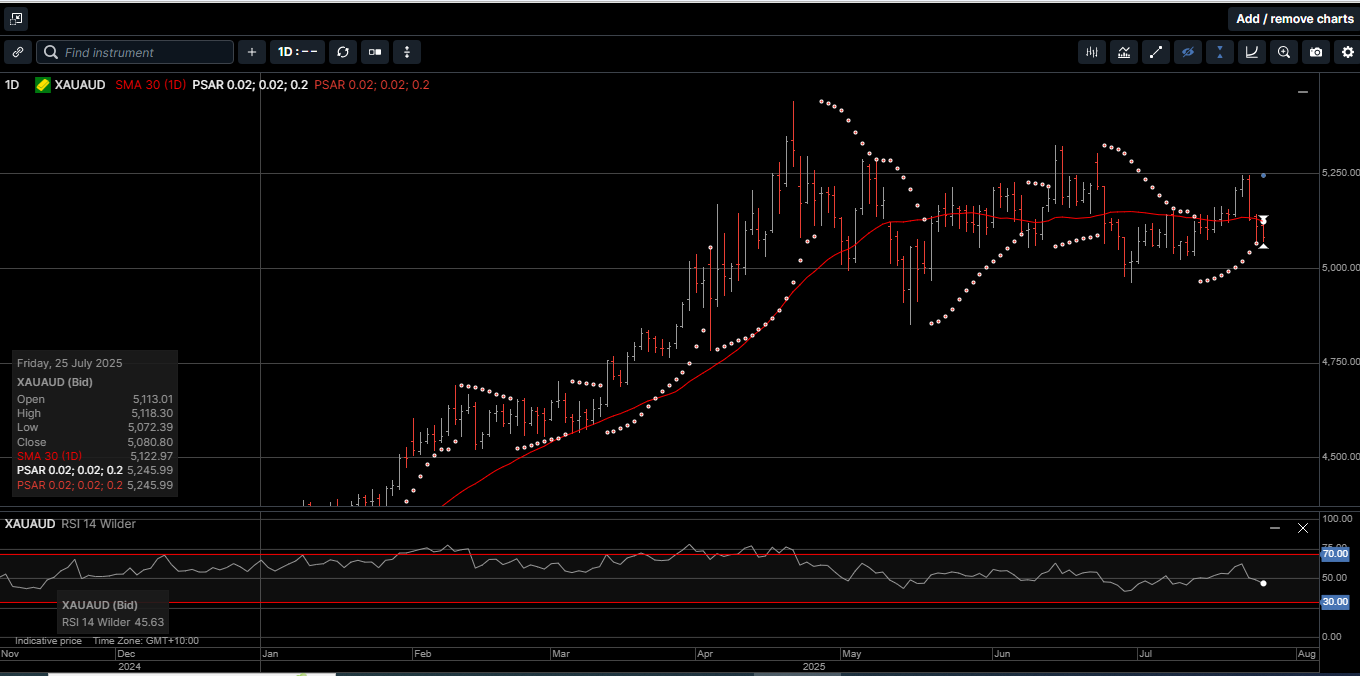
Chart 5 Silver AUD
This publication has been prepared for the GBA Group Companies. It is for education purposes only and should not be considered either general of personal advice. It does not consider any particular person’s investment objectives, financial situation or needs. Accordingly, no recommendation (expressed or implied) or other information contained in this report should be acted upon without the appropriateness of that information having regard to those factors. You should assess whether or not the information contained herein is appropriate to your individual financial circumstances and goals before making an investment decision, or seek the help the of a licensed financial adviser. Performance is historical, performance may vary, past performance is not necessarily indicative of future performance. Any prices, quotes or statistics included have been obtained from sources deemed to be reliable, but we do not guarantee their accuracy or completeness.