Metals Slide On “Hot” US Inflation Data
The strong post-election gains in the precious metals complex were largely reversed last week.
The hotter-than-expected readings on US Consumer and Producer inflation lifted the probability of a December rate hike and pressured hard assets back into technical support levels.
With less than four weeks until the next Federal Open Market Committee (FOMC) meeting, even secondary economic data could have an outsized impact on Gold, Silver, and Platinum prices.
Physical Gold priced in USD tagged a three-week high at $4150.00 last Monday before reversing lower to post a 13-month low at $3855.00.
The yellow metal finished the week 4.5% lower at $3885.00. The daily Relative Strength Index (RSI) is flatlining under 40.00. Initial support is $3800.00 and a close above the 30-Day Moving Average (30-DMA) at $4065.00 is needed to turn momentum indicators positive.
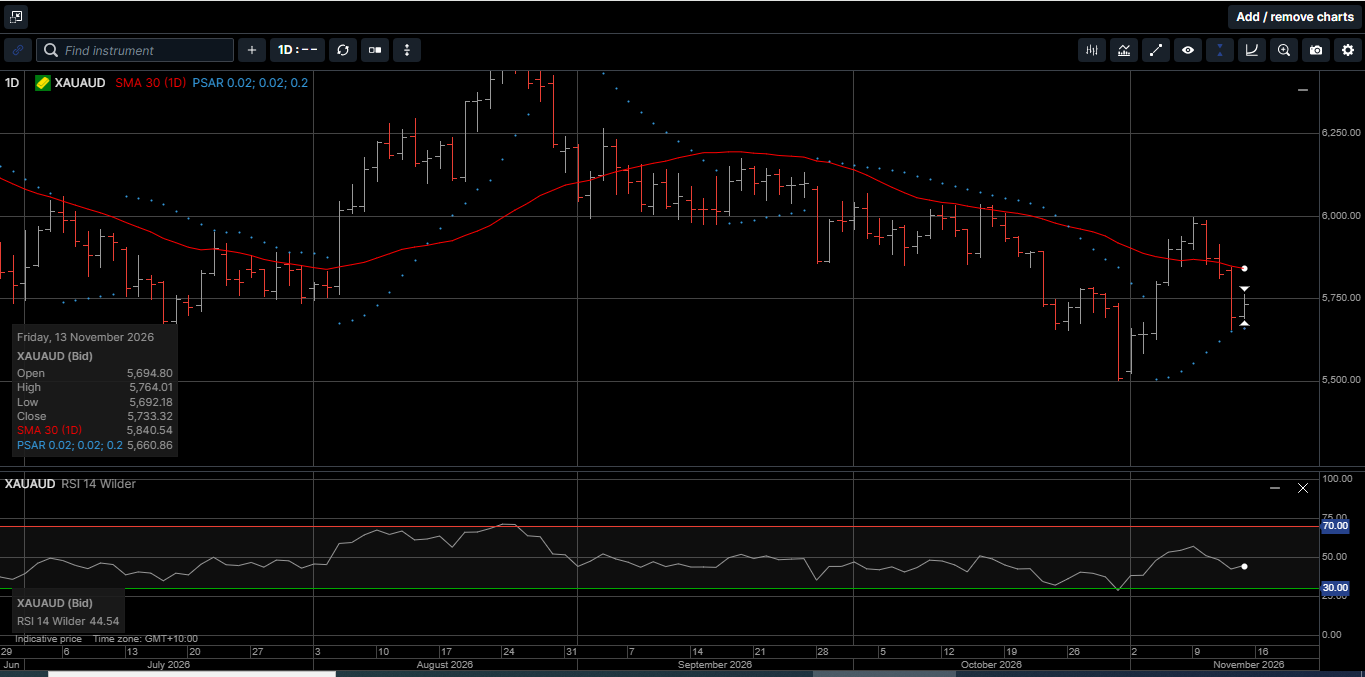
Gold denominated in AUD held above recent lows but closed out the week 3.2% lower at $5733.00. The losses were limited because of the 2.5% weekly loss in the AUD/USD.
The daily RSI is 44.50 and pointing higher. Initial support is $5590.00, and resistance is the 30-DMA near $5840.00. A daily close above $5940.00 would suggest a durable low is in place.
Physical Silver priced in USD hit a fresh 12-month low at $48.45 last Friday and closed out the week 6.7% lower at $48.75.
The daily RSI is 32.80, which is back in technically oversold territory. Initial support is $47.90, and resistance is the 30-DMA near the 54.70 level.
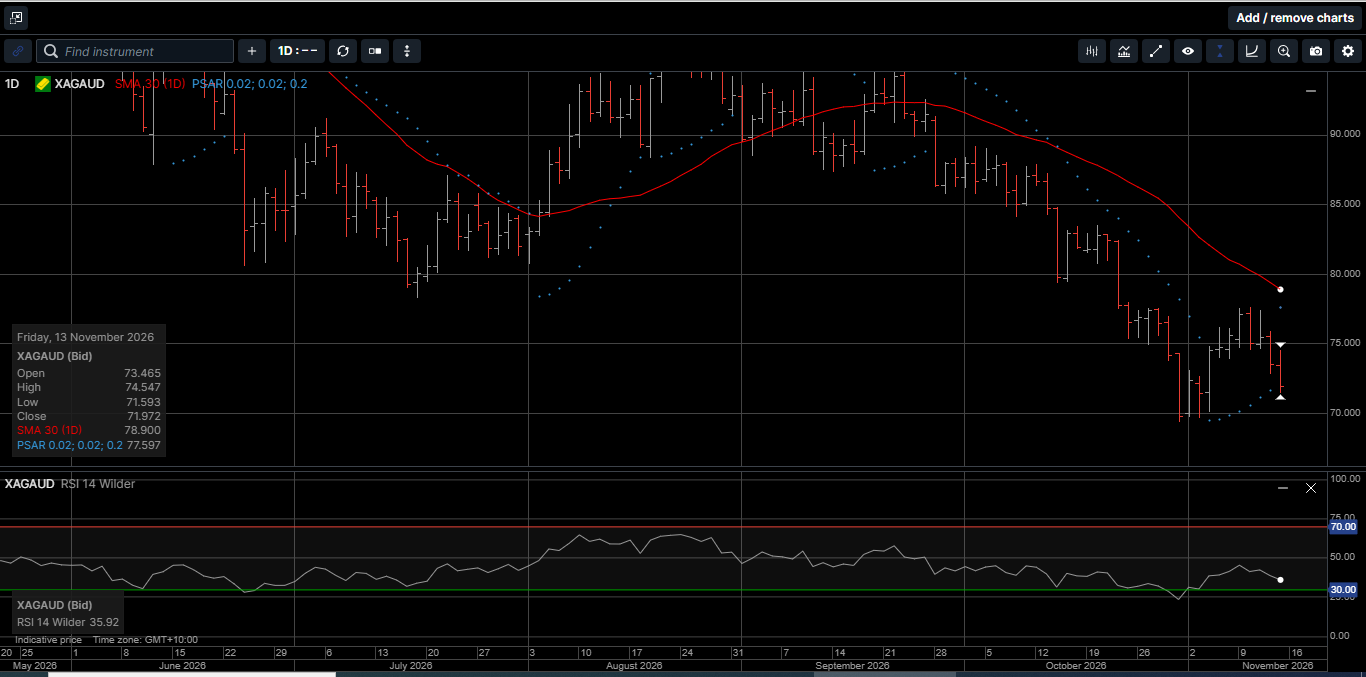
Silver denominated in AUD pared losses due to the AUD/USD weakness but still finished the week 5.3% lower at $71.60. The daily RSI is 36.00 and pointing lower.
Initial support is $71.00, and a close above the 30-DMA at $78.40 would improve the technical outlook.
The Gold versus Silver ratio finished the week 1.6% higher in favor of Gold at 79.50, which means it takes 79.50 ounces of Silver to equal the price of one ounce of Gold.
We have been looking for this ratio to roll over in favor of Silver for the last several weeks. The technical indicators remain overbought, which suggests Silver could outperform Gold over the medium term.
Physical Platinum reached a two-week high at $1587.00 on Tuesday before falling sharply to close out the week 2.9% lower at $1481.00.
The daily RSI is 40.00 and pointing lower. Initial support is $1425.00, and resistance is just above the 30-DMA at $1575.00. Overall, the technical picture for Platinum looks constructive for a run higher over the medium term.
As mentioned above, last Friday, the Bureau of Labor Statistics announced that the US Producer Price Index (PPI) accelerated to 6.5% year-over-year in October, the worst inflation for American businesses since November 2022.
The September month-to-month increase was revised up to +1.41% (+18.3% annualized), which pushed the index up to the pandemic highs dating back to 2021.
The US Consumer Price Index rose 0.4% in October, above the 0.3% economists expected and 0.3% in the core monthly data.
We understand the how the “cause and effect” dynamic of these inflation numbers are perceived by short-term traders.
US FED officials have been talking about aggressively raising rates to lower inflation back to their 2% target; the prospects of higher FED funds rates lift the USD and pressures the precious metals lower.
But is there real evidence that the FED would raise rates to the point of risking an economic recession, and perhaps a systemic banking crisis, just to get inflation back to 2.0% ?
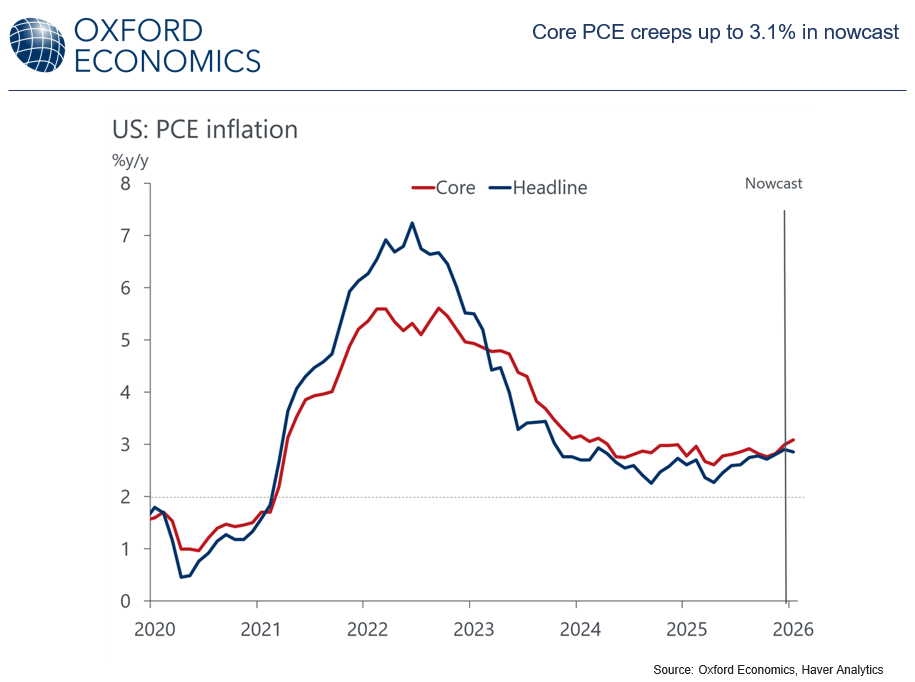
As illustrated on Chart 1, the FED’s favorite measure of consumer inflation is the Personal Consumption Expenditures (PCE), which has tracked above the FED’s 2.0% target for almost six years.
Further, as shown on Chart 2, between September 2024 and December 2025, the FED cut the FED Funds rate five times for a total of 125 basis points of easing, all while the PCE was above the 2.0% target.
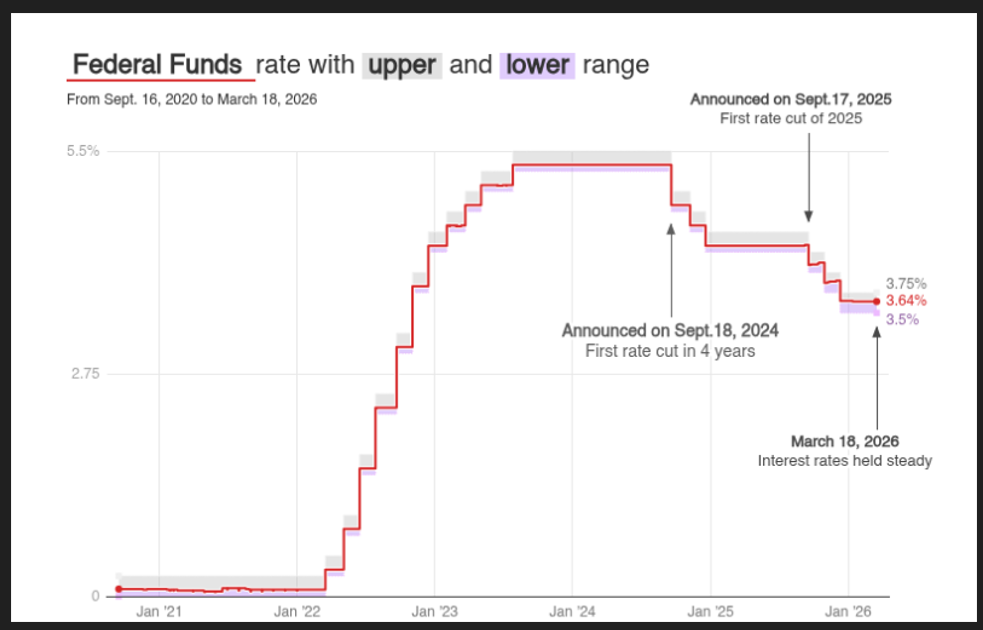
In fact, at the time of each one of those rate cuts, the PCE was above the current PCE reading of 3.4%.
So, has the FED recalibrated their priorities and decided to really get tough on Consumer and Producer inflation in America by raising the FED Funds rate aggressively ?
Probably not.
Almost every investor around the globe understands that the US Federal Reserve sets out the policy for the short-term FED Funds rate.
However, many investors are not aware that the FED also controls the expansion and contraction of the US Money Supply.
Ordinarily, as part of a monetary tightening cycle, the FED would remove cash from the banking system as part of the process of reducing liquidity and shrinking their balance sheet.
As shown on Chart 3, the US M2 money supply surged by $102.8 billion in July, to a record $23.22 trillion.
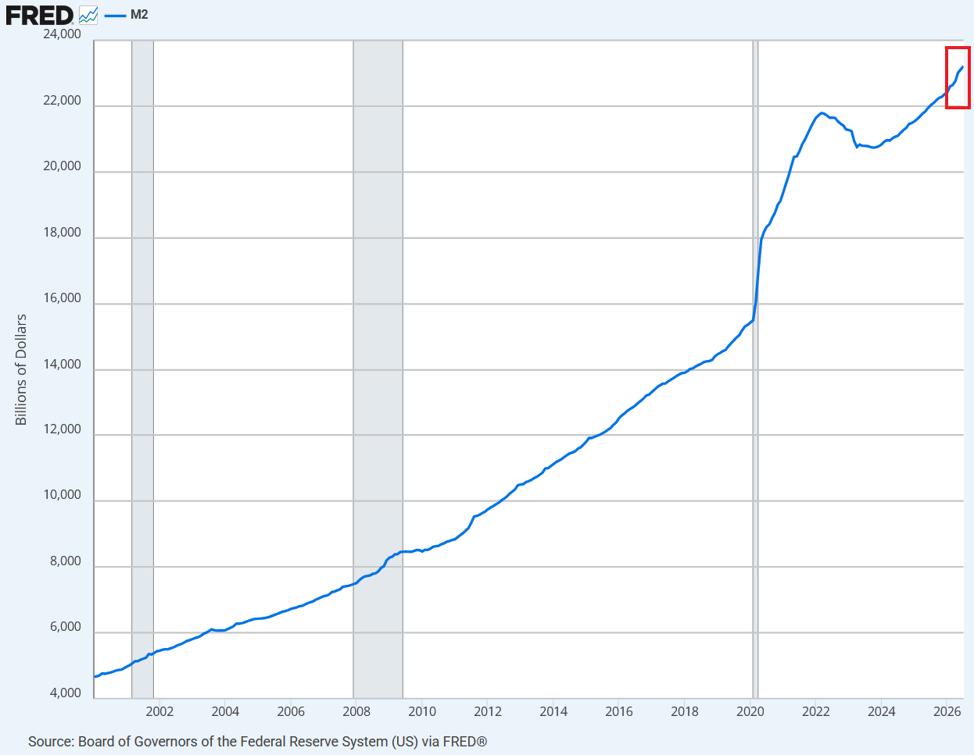
This marks the 27th consecutive monthly increase.
Since the start of 2026, M2 has now risen by $862.7 billion and is not showing any signs of reverting lower.
The bottom line is, aside from talking about getting tough on inflation, the FED has done very little that is clear evidence that they are prepared to actually follow through with a protracted rate hike cycle.
As such, there will likely come a time in the near future when even short-term investors realize that they have been misreading the economic tea leaves with respect to inflation and FED policy.
This will likely trigger buying the dip in physical Gold, Silver, and Platinum.
Central banks and large sovereign institutions realize that governments can print money, but they can’t print hard assets.
Hard assets represent a store of value and wealth security against fiat currency debasement, government fiscal profligacy, and geopolitical instability.
In short, the precious metals complex is back at the levels where provident, long-term investors accumulate more physical metal before the next leg higher.
Now is the time to consider investing in real money, and making physical Gold, Silver and Platinum the cornerstone assets in your long-term wealth creation strategy.
This publication has been prepared for the GBA Group Companies. It is for education purposes only and should not be considered either general of personal advice. It does not consider any particular person’s investment objectives, financial situation, or needs. Accordingly, no recommendation (expressed or implied) or other information contained in this report should be acted upon without the appropriateness of that information having regard to those factors. You should assess whether or not the information contained herein is appropriate to your individual financial circumstances and goals before making an investment decision or seek the help the of a licensed financial adviser. Performance is historical; performance may vary; past performance is not necessarily indicative of future performance. Any prices, quotes or statistics included have been obtained from sources deemed to be reliable, but we do not guarantee their accuracy or completeness.