Gold And Silver Rebound Post FOMC Rate Hike
The precious metals complex experienced elevated volatility last week as markets weighed the impact of tighter monetary policy versus rising geopolitical tensions.
As expected, the US FOMC raised the FED Funds rate by 25 basis points, which pushed hard assets lower.
However, the 7.1% fall from the mid-week high in Crude Oil prices lifted the precious metals into the weekend.
On balance, last week’s technical price action suggests that upside momentum is building for a longer-term rally in Gold, Silver, and Platinum.
Physical Gold priced in USD traded below the 30-Day Moving Average (30-DMA ) during every session last week but picked up almost 1.0% to close at $4377.00.
The daily Relative Strength Index (RSI) is 51.00 and pointing higher. Initial support is $4260.00 and resistance is above the 30-DMA at $4450.00
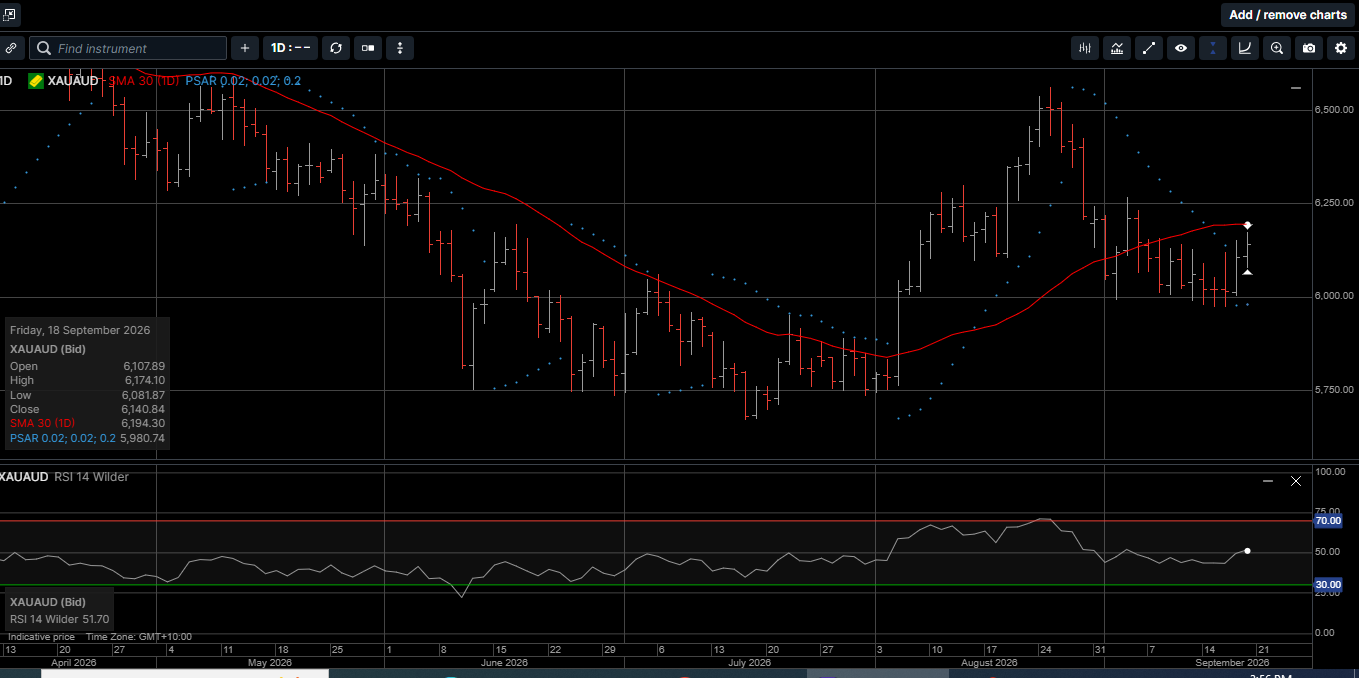
Gold denominated in AUD traded with an upside bias and rose 1.3% to finish the week at $6140.00. The daily RSI is 51.70. Strong support has been seen at $6000.00, and resistance is near the 30-DMA at $6195.00
Physical Silver priced in USD posted a 2.7% weekly gain to close just above the 30-DMA at $66.25. The daily RSI is 54.00 and rising.
A close above $68.30 would improve the technical tone and suggest a durable low is in place near $62.00.
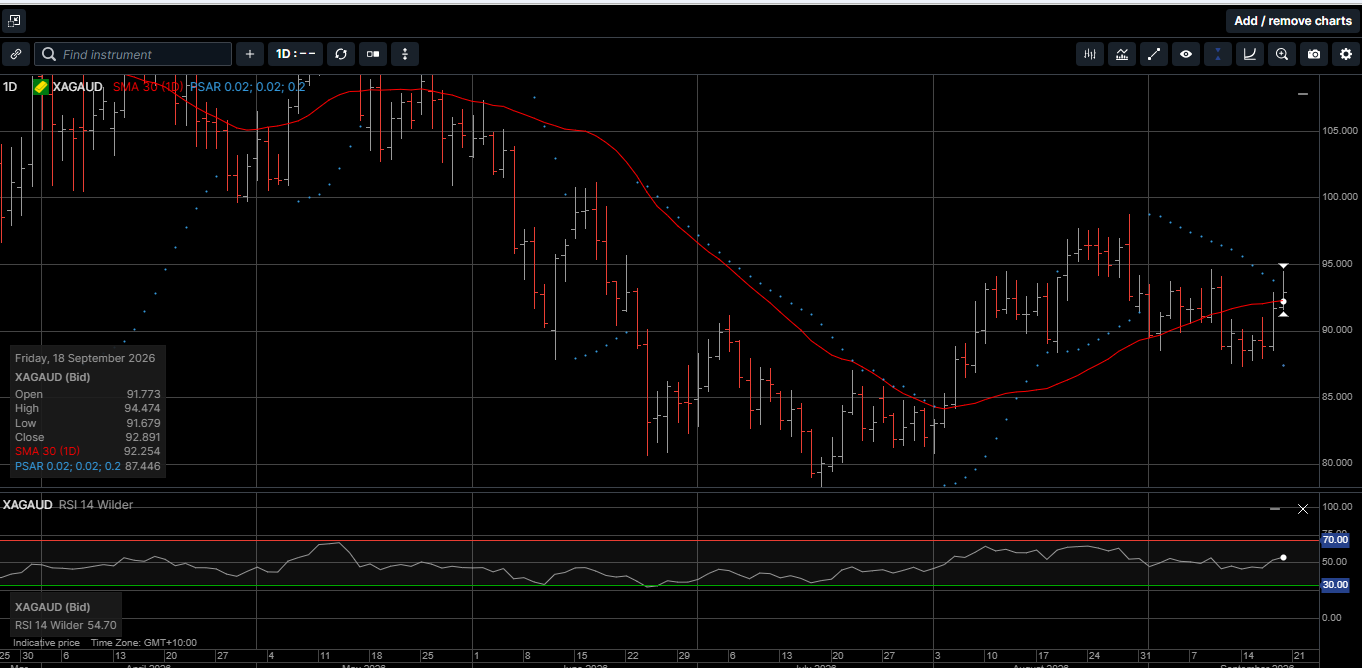
Silver denominated in AUD finished the week 3.4% higher and closed above its 30-DMA at $92.90. The daily RSI reflects a bullish reading of 54.70.
A daily close above $95.50 would break above the technical Flag Pattern and suggest further upside range extension.
The Gold versus Silver ratio slipped 2.0% lower in favor of Silver to close at 66.00, which means it takes 66.00 ounces of Silver to equal the price of one ounce of Gold.
A break below the 64.60 level could point to the June lows between 62.30 and 62.50.
Physical Platinum rallied last Friday to post a second consecutive weekly close above its 30-DMA near $1805.00. the daily RSI is 52.25 and pointing higher, which suggests a move back into the $1870.00 to $1880.00 resistance range.
With FED Chairman, Kevin Warsh, presiding over his third Federal Open Market Committee (FOMC) meeting, the 12 voting FOMC members unanimously agreed to a 25-basis-point rate hike, bringing the Fed’s policy rates to 3.75-4.0%.
The months long commotion in the bond market had been calling for a rate hike; the forward markets had priced in an almost 90% probability of a rate hike, and credit markets probably would have been shocked if no rate hike had come.
In fact, treasury yields might have spiked further if the FOMC had passed on what we consider a symbolic rate hike.
In recent decades, the FED has hiked in a series of rate hikes before switching to rate cuts. The last time The FED hiked only once, a single-rate-hike cycle, before cutting again was in March 1997.
We understand that if history has any suggestions to make now, it indicates that this is the beginning of a new rate-hike cycle, and not a one-and-done.
That scenario is not our base case.
Consider, metaphorically, the US economy is an automobile driving down the highway.
You have the Treasury department pushing down the gas pedal by intervening in the bond markets to cap long term yields and maintain easier financial and credit conditions.
And now the FED has raised rates on the short end of the interest rate curve, effectively pushing down on the brakes.
Since Mr. Warsh took over at the FED in May; his policy mantra has been to fight consumer inflation which, at 3.6% is above the FED’s target of 2.0%.
However, as illustrated on Chart 1, the most prominent component driving consumer inflation has been the sharp rise in energy prices during the last six months.
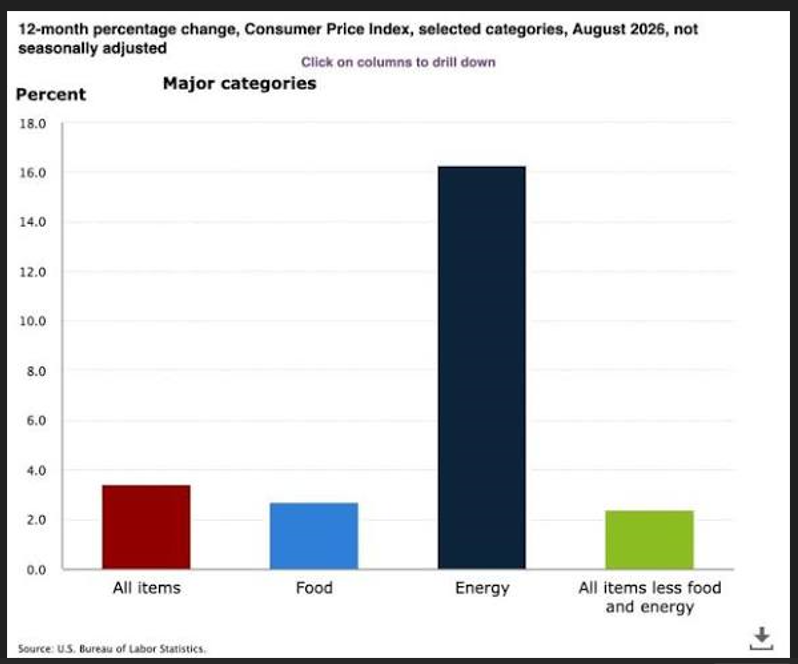
The market has widely accepted that the sharp rise in consumer energy prices has been caused by the ongoing conflict in the Persian Gulf and not loose monetary policy in America.
Along those lines, we do not believe that one rate hike, or a cycle of rate hikes, would have an immediate or material impact to push consumer energy prices lower.
Further, last week’s rate hike will not reduce or even slow down the growth of US sovereign debt, which is estimated to expand by more than $2.5 trillion this fiscal year.
A protracted rate hike cycle will only make the US debt more expensive to finance, which is what we believe will prevent the FED from lifting rates as an ongoing policy.
As shown on Chart 2, as interest rates move higher, the bonds and securities on the FED’s balance sheet continue to lose billions in market value.
Chart 2 only shows a fraction of the FED’s total holdings that are in the red.
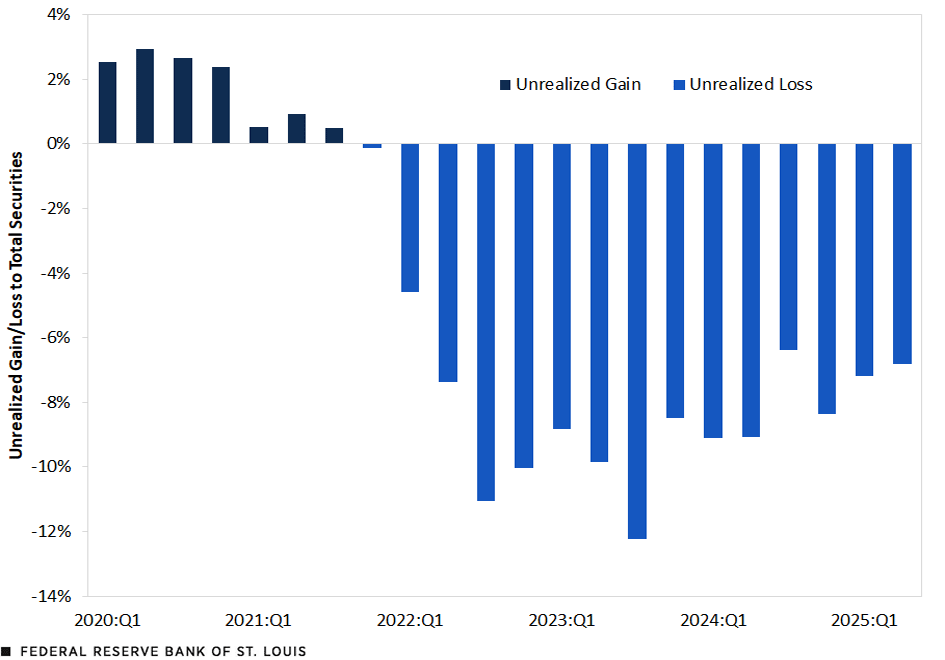
In a recent report from the US Office of Management and Budget, the FED’s System Open Market Account (SOMA), which includes T-Bills, Bonds and Mortgage-Backed Securities, is now carrying open losses of more than $800 billion.
Now that the FED has placated the bond market with a rate hike, it’s reasonable to believe that the seasonal trading cycles for Gold, Silver and Platinum will gain more traction.
It is worth pointing out that between September 1st and December 28th of last year, USD and AUD Gold returned 44% and 28%, respectively.
During that same period of time, USD Silver rallied an eye-watering 145%, the price of AUD Silver more than doubled, and Platinum rose an impressive 78%.
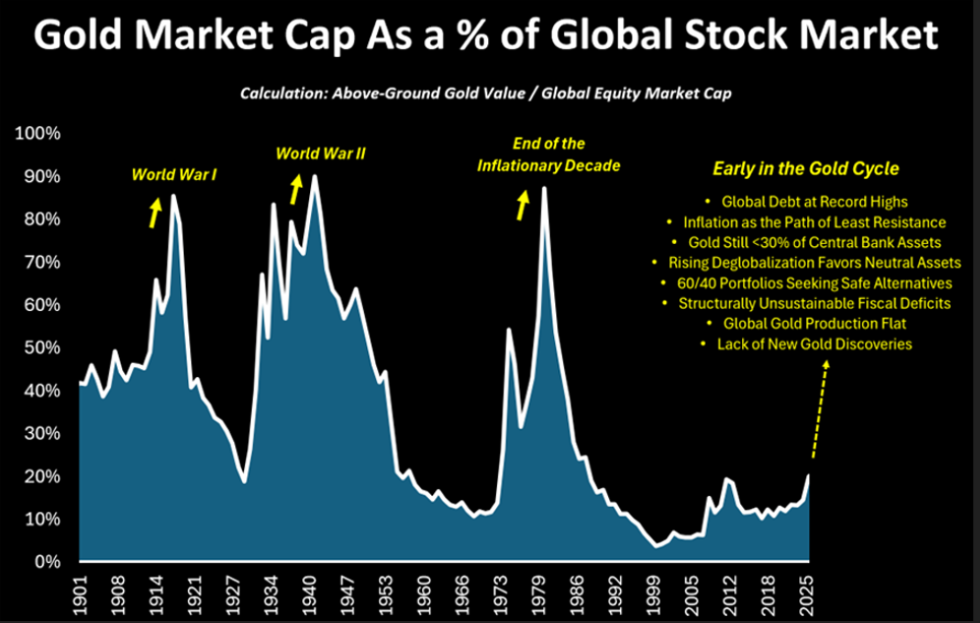
While some market commentators believe that last year was an anomaly and the bull market in the precious metals has pretty much run its course, we believe the repricing of hard assets higher is still in the early stages.
As shown on Chart 3, over a long-term time horizon, the Gold market capitalization compared to stocks is acutely underrepresented, undervalued and has a long way to run higher.
Physical hard assets offer wealth security, a store of value during economic uncertainty, a safe haven from geopolitical tensions, and eliminate government counterparty risk.
As such, now is the time to consider adding to your physical holdings and making Gold, Silver and Platinum the cornerstone assets in your long-term wealth creation strategy.
This publication has been prepared for the GBA Group Companies. It is for education purposes only and should not be considered either general of personal advice. It does not consider any particular person’s investment objectives, financial situation, or needs. Accordingly, no recommendation (expressed or implied) or other information contained in this report should be acted upon without the appropriateness of that information having regard to those factors. You should assess whether or not the information contained herein is appropriate to your individual financial circumstances and goals before making an investment decision or seek the help the of a licensed financial adviser. Performance is historical; performance may vary; past performance is not necessarily indicative of future performance. Any prices, quotes or statistics included have been obtained from sources deemed to be reliable, but we do not guarantee their accuracy or completeness.