Gold And Silver Rally As The US Debt Cracks $40 Trillion
After breaking out of a two-month consolidation pattern in early August, the precious metals complex now looks poised to take another leg higher.
The US Treasury Department’s intervention in the bond market last week, combined with record high fiscal deficits, has driven investors back into the safe haven of hard assets.
As Gold, Silver and Platinum climb higher, it appears that the pullback in prices earlier this year was not a warning, but an opportunity.
Physical Gold priced in USD posted a 3.5 month high at $4631.00 before drifting lower to close 5.2% higher at $4602.00.
The daily Relative Strength Index (RSI) is 70.50 and pointing higher. Initial chart support is $4490.00, and the next resistance area is near the double top at $4775.00 dating back to mid-May.
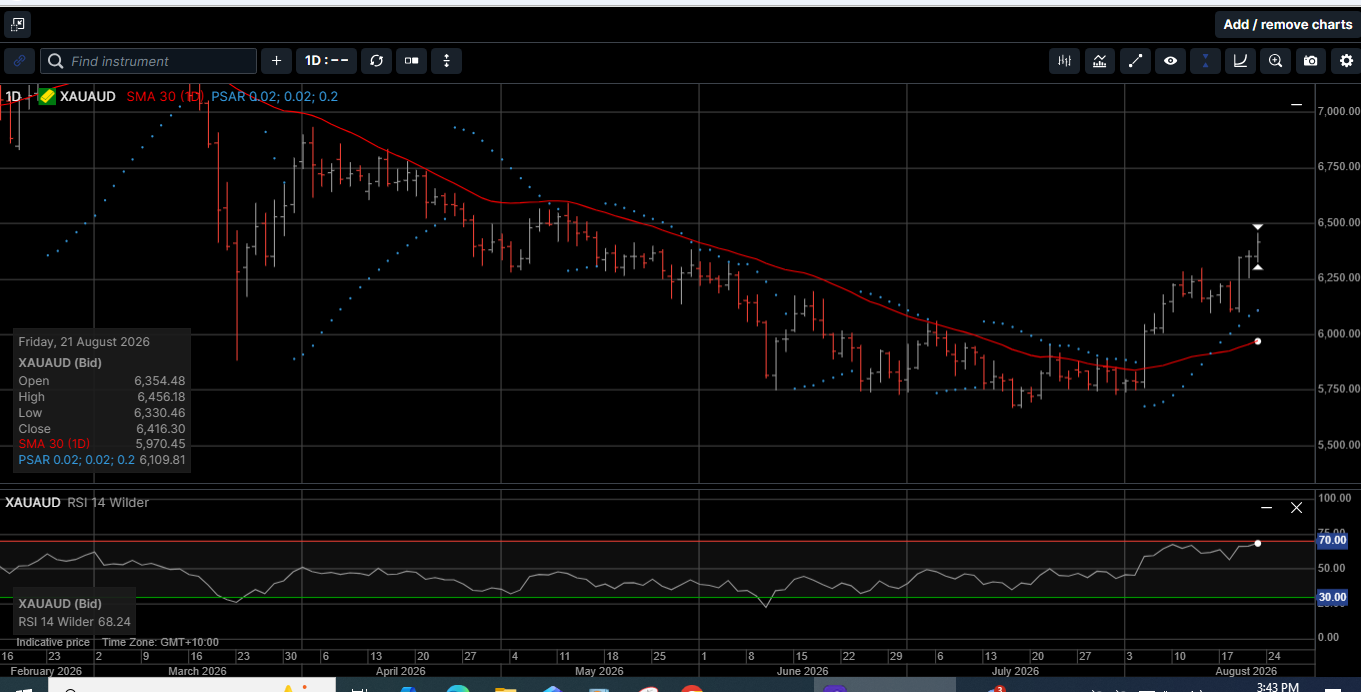
Gold denominated in AUD reached a three-month high at $6456.00 and finished the week 3.9% higher at $6416.00.
AUD Gold has traded higher during 10 of the last 13 trading sessions with a daily RSI of 68.25. Initial support is $6275.00, and resistance is in the $6650.00 to $6680.00 range.
Physical Silver priced in USD tagged a two-month high at $70.05 before slipping lower into the weekend to close 6.6% higher at $68.95.
The daily RSI is 65.85 and pointing higher. Initial support is $66.85, and resistance is near the triple top at $71.50 dating back to mid-June.
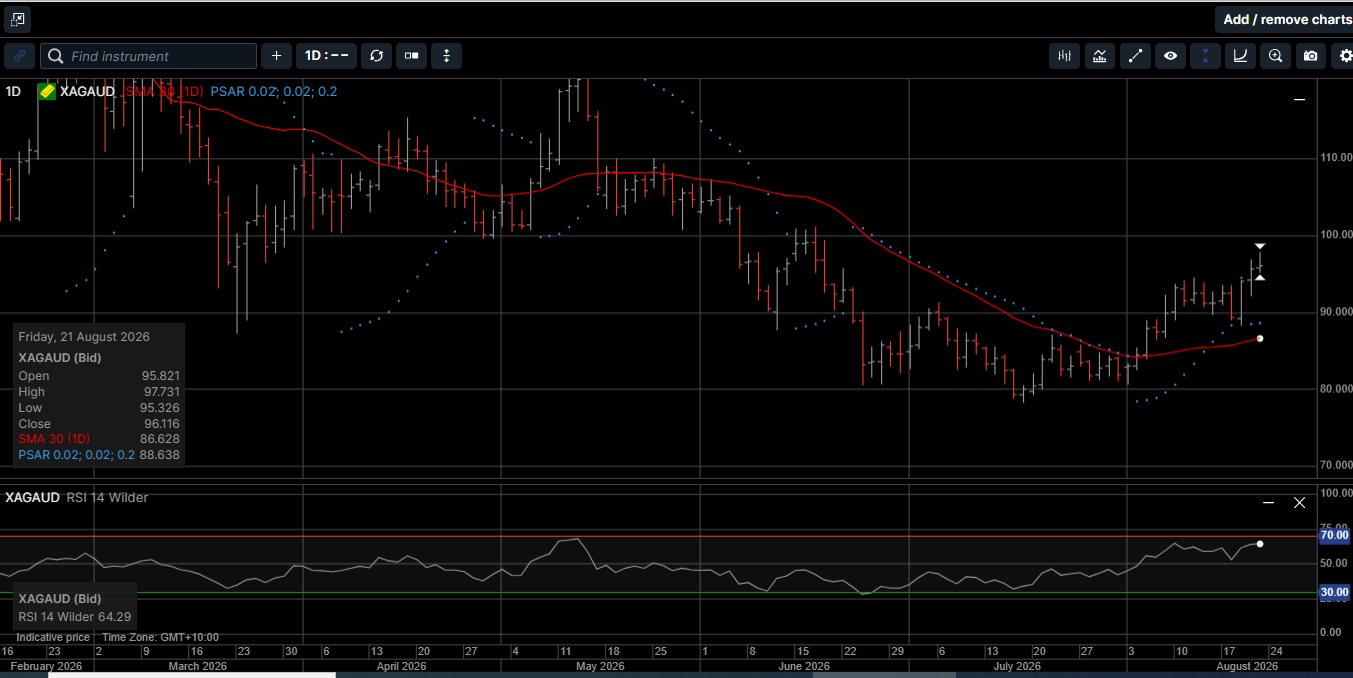
Silver denominated in AUD hit a two-month high at $97.50 on the way to a weekly gain of 5.3% and a Friday close at $96.11.
AUD Silver has traded higher during five of the last six trading sessions with a daily RSI reading of 64.25. Initial support is $89.20, and resistance is in the $101.10 to $101.50 range.
The Gold versus Silver ratio fell 1.3% in favor of Silver to 66.55. This means it takes 66.55 ounces of Silver to equal the price of one ounce of Gold.
The daily chart structure suggests the ratio will target the 62.00 handle in the near-term.
Physical Platinum reached a 3.5 month at $1910 on the way to an impressive weekly gain of 7.5% with a close at $1878.00.
The daily RSI is 67.70 and pointing higher. Initial support is near $1780, and the next upside target is the $1910.00 to $1940.00 range.
We regularly reference the growing global sovereign debt problem as a component of economic uncertainty.
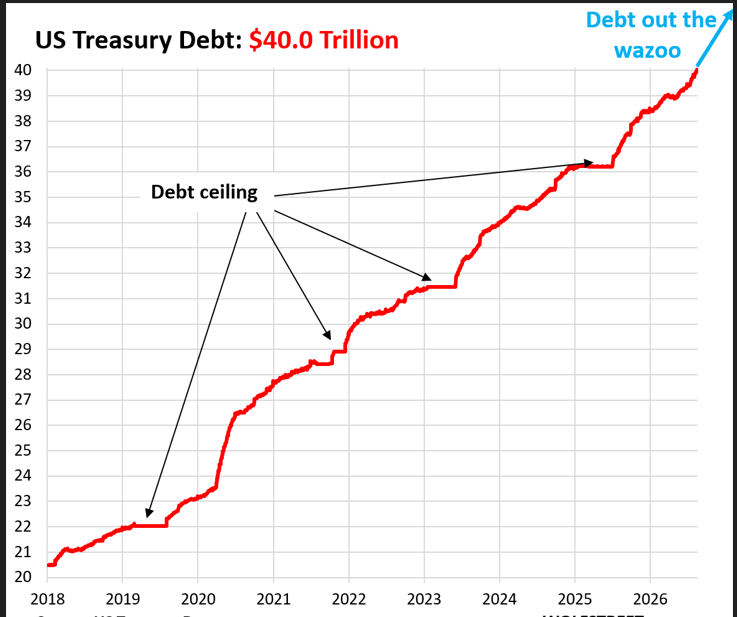
According to Treasury Department data released last week, the total US debt crossed $40 trillion; only about five months after it crossed $39 trillion in March.
As illustrated on Chart 1, ten years ago, the debt was around $19 trillion, meaning the US government has managed to more than double the national deficit balance in just over a decade.
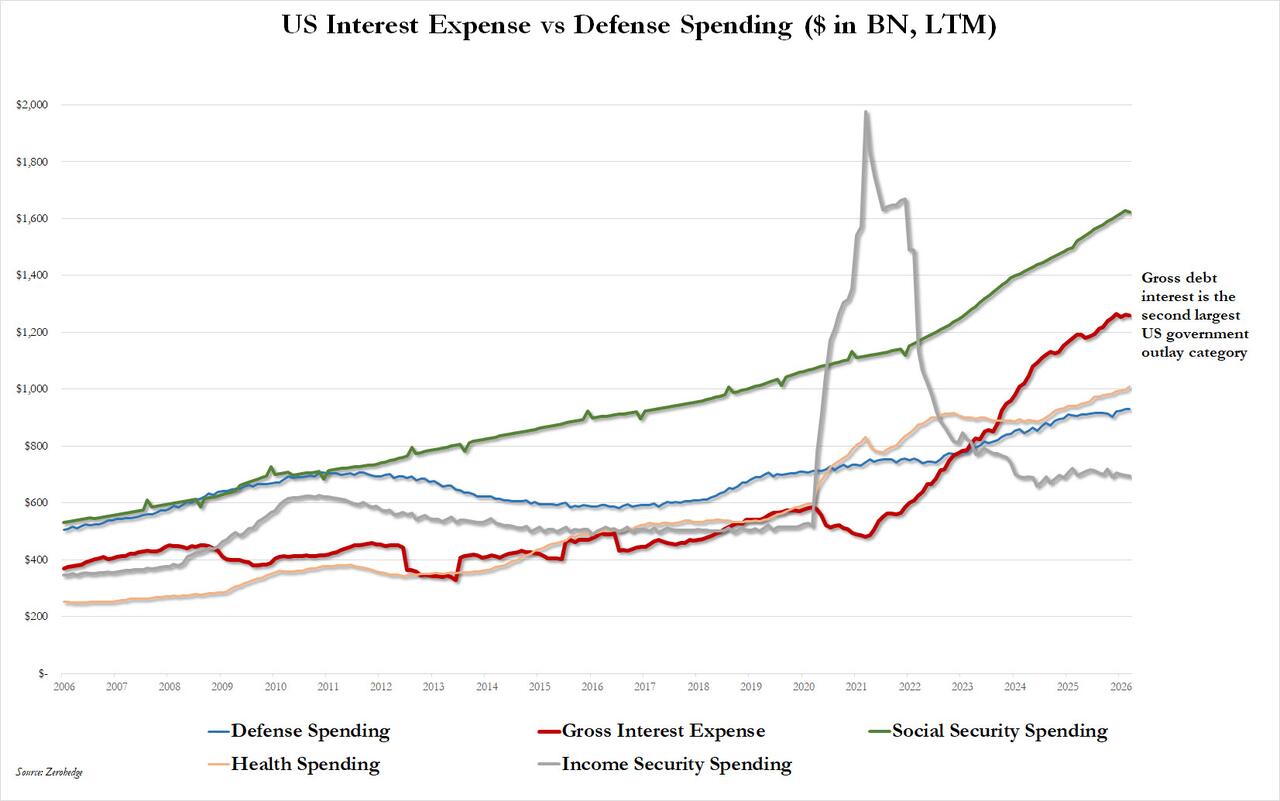
Meanwhile, as shown on Chart 2, interest expense has become the government’s second largest capital outlay behind Social Security.
Further, the pace at which the US debt is expanding is even more unsettling than the $40 trillion headline itself.
For example, it took the US almost 200 years to accumulate its first $1 trillion of national debt, which it finally crossed in 1981.
By extension, the US crossed the $30 trillion debt mark in 2022, $38 trillion in October 2025, $39 trillion in March 2026 and now $40 trillion roughly five months later.
In early July, the US Joint Economic Committee of Congress calculated that the debt had increased by $3.16 trillion in just the previous twelve months, equivalent to more than $8.6 billion per day or about $360 million every hour.
To put a finer point on the enormity of these numbers, if a person had $1 trillion in cash, they could spend $100 million every single day for over 27 years.
The US government used to measure trillion dollar increases in the deficit in terms of generations, then they measured them in years, and now apparently, the US leadership is going to measure them in months.
The problem isn’t simply that the US owes $40 trillion, because a sovereign government issuing debt in its own currency can obviously continue borrowing for a very long time and print more money.
The problem arrives when the buyers of that debt begin demanding an interest rate that the government, economy and financial system cannot comfortably tolerate, especially when trillions of dollars of existing debt must continually be refinanced at higher rates.
Once the price demanded by the bond market collides with the price Washington can afford to pay, somebody eventually has to blink.
We may have gotten our first glimpse of that conflict last Wednesday, when Treasury Secretary Scott Bessent announced that the Treasury would double the size of buyback operations involving longer dated Treasuries from $2 billion to at least $4 billion per operation.
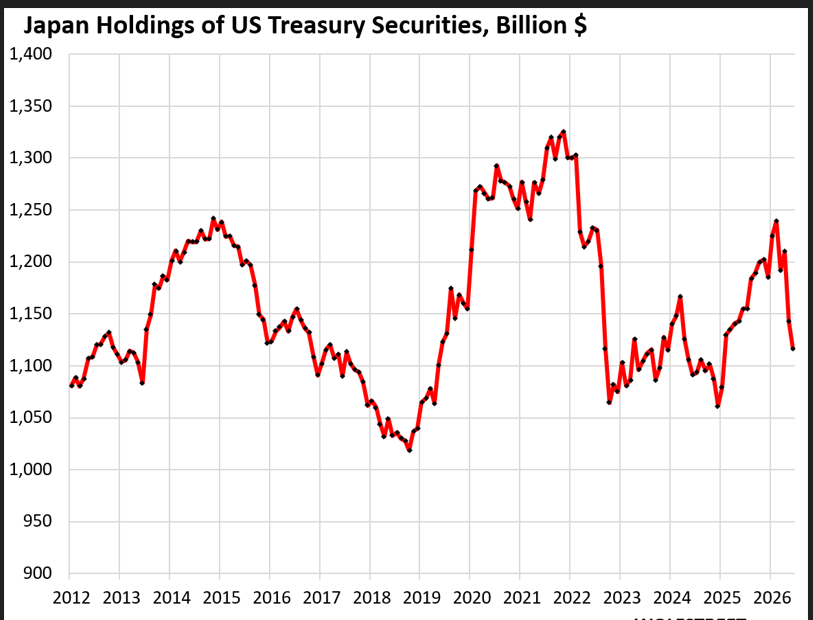
Part of the reasoning for this operation was driven by the fact that Japan, as shown on Chart 3, has liquidated over $220 billion of their US bond holdings this year.
The operations announced last week cover debt in the 10-to-30-year portion of the curve and came after the 30 year Treasury yield reached its highest level since 2007.
Investors in US debt are concerned about the enormous government financing requirements and the broader deterioration in America’s fiscal position.
After last week’s announcement, long duration Treasury yields dropped sharply, the USD weakened, and Gold, Silver and Platinum exploded higher.
In fact, Gold surged more than 3% last Wednesday as the market immediately interpreted the announcement through the prism of easier financial conditions, potential government support for the bond market, and lower FED Funds rates.
Some market commentators are describing the Treasury’s move as a kind of stealth yield curve control or the beginning of the next round of Quantitative Easing.
We would describe the move as the Treasury injecting a new dynamic into the monetary policy mix that sends an unmistakable message about how uncomfortable policymakers have become with what is happening at the long end of the debt curve.
It underscores what we have known, and amplifies what we have suspected, about the fragility of the US sovereign debt market.
Clearly, Treasury Secretary Bessent has deep concerns about the steepening of the US yield curve and how that will impact the increasingly large burden of servicing the $40 trillion debt.
As such, last week’s change in Treasury fundamentals and implications for lower interest rates is a call to action for long-term investors looking for a store of value in the most secure form of wealth: hard assets.
Hard assets have represented the purest form of money for hundreds of years because they have no counterparty risk and tend to increase in value during times of economic uncertainty.
The precious metals have traded above key technical resistance levels over the last three weeks.
Now is the time to consider divesting in risky paper assets, and making physical Gold, Silver and Platinum the cornerstone assets in your long-term wealth creation strategy.
This publication has been prepared for the GBA Group Companies. It is for education purposes only and should not be considered either general of personal advice. It does not consider any particular person’s investment objectives, financial situation, or needs. Accordingly, no recommendation (expressed or implied) or other information contained in this report should be acted upon without the appropriateness of that information having regard to those factors. You should assess whether or not the information contained herein is appropriate to your individual financial circumstances and goals before making an investment decision or seek the help the of a licensed financial adviser. Performance is historical; performance may vary; past performance is not necessarily indicative of future performance. Any prices, quotes or statistics included have been obtained from sources deemed to be reliable, but we do not guarantee their accuracy or completeness.