Gold And Silver Firm On Soft Macro-Data
US Consumer Inflation eased for the second month in a row last week, while US Retail Sales printed a negative number for the first time in six months.
Combined, these data points pushed rate hike expectations lower, which trimmed the USD and lifted the precious metals complex higher.
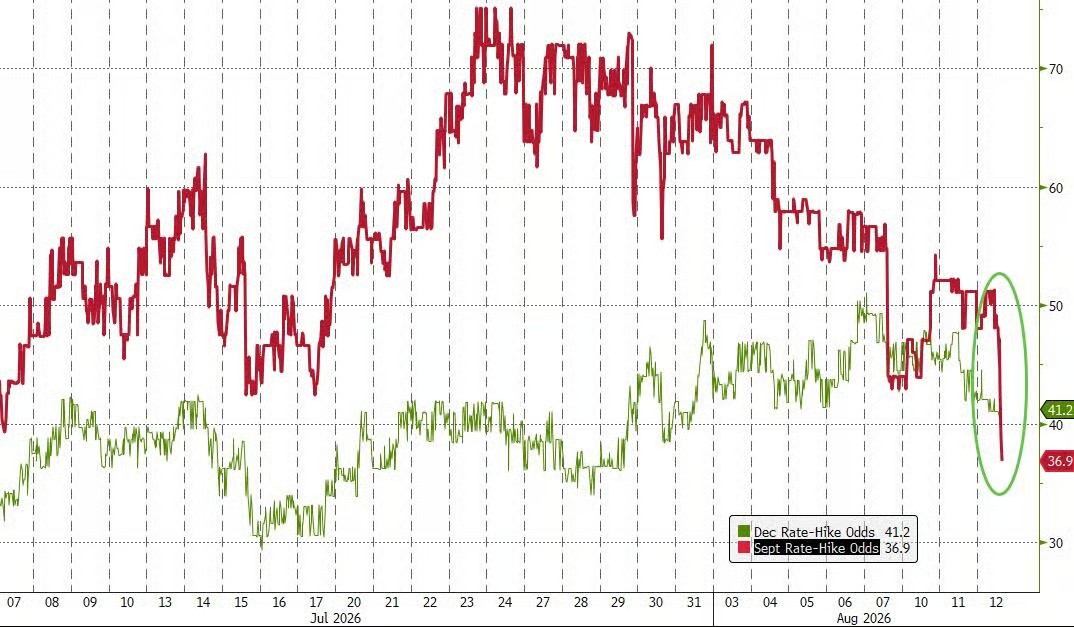
As illustrated below on Chart 1, based on the FED Funds futures, the probability of a rate hike at the September FOMC meeting has dropped from 65% two weeks ago to 35% now.
We expect the flat, to lower, interest rate trajectory will act as a tailwind for Gold, Silver, and Platinum prices.
Physical Gold priced in USD extended last week’s two-month high to reach $4450.00 before slipping lower to close out the week 1.1% higher at $4375.00.
The daily Relative Strength Index (RSI) is 63.40, which is not in overbought territory. We see initial support in the $4220.00 area and the next upside target between $4540.00 and $4560.00.
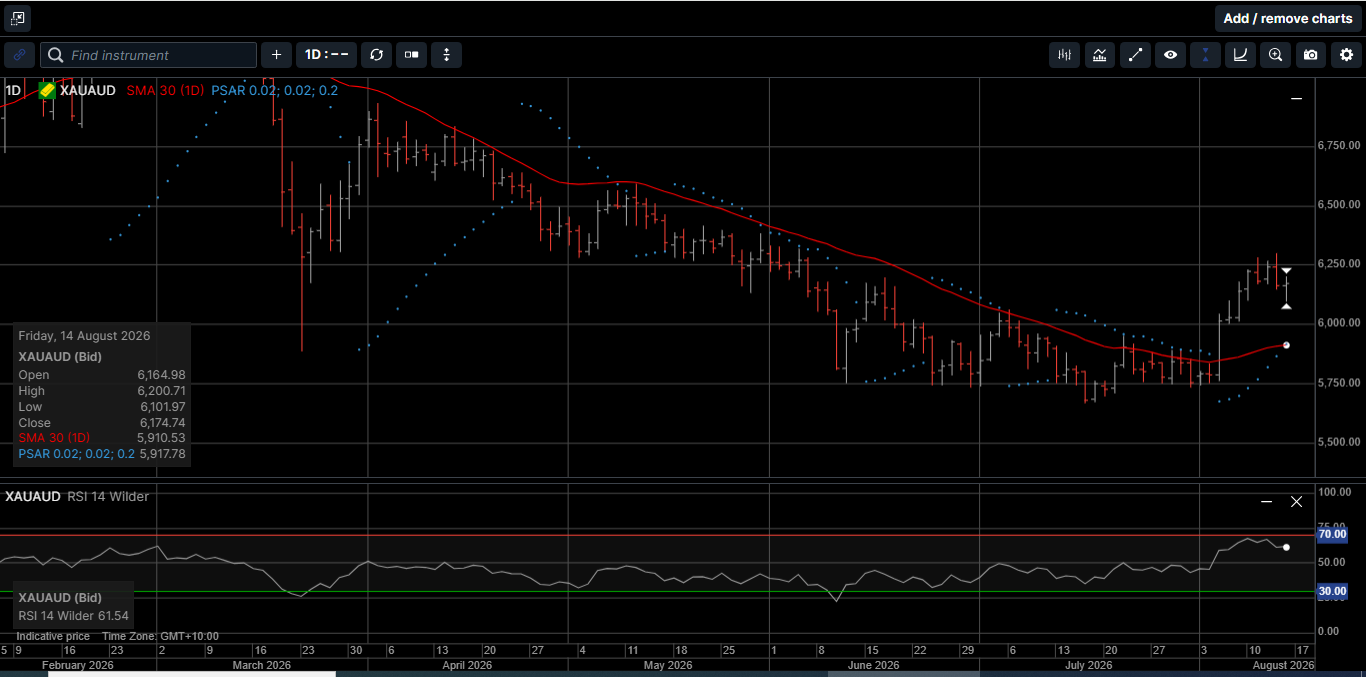
Gold denominated in AUD hit a seven-week high just shy of $6300.00 and finished the week 1% higher at $6174.00.
AUD Gold traded higher during six of the last eight trading sessions, and the daily RSI is 61.50. We see initial support at $6010.00 and resistance at $6345.00.
Physical Silver priced in USD reached a fresh seven-week high at $66.80 on the way to a weekly gain of 1.8% and a close at $64.70. The daily RSI is 59.70 and pointing higher. Initial support is $62.80, and the next area of resistance is $67.90.
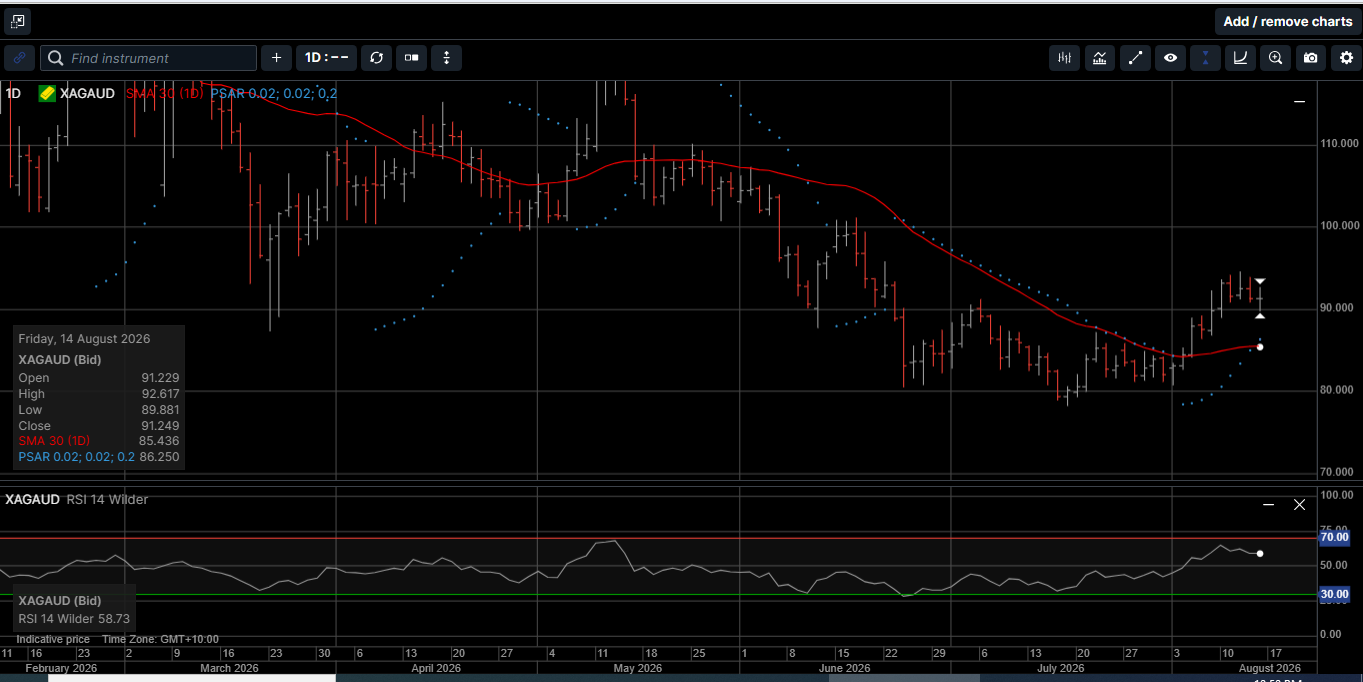
Silver denominated in AUD tagged a two-month high at $94.45 and finished the week 1.5% higher at $91.25. The daily RSI is 58.60 and pointing higher, which suggests a near-term move back over $97.00. Initial support is $87.90.
The Gold versus Silver ratio dropped by 1.0% in favor of Silver last week to close at 67.50. This means it takes 67.50 ounces of Silver to equal the price of one ounce of Gold.
Technical readings are currently neutral, but we expect Silver to outperform Gold and the ratio to trend lower over the medium-term.
Physical Platinum traded in a relatively narrow range between $1700.00 and $1780.00 and closed fractionally higher at $1746.00. The daily RSI is 58.30 and pointing higher.
There is a cluster of intraday tops near $1780, which suggests a close above that level could trigger a fresh wave of buying into the $1850.00 area.
It seems the majority of incoming US economic data is viewed through a prism of how it will impact FOMC rate policy, and by extension, US Treasury yields, which makes sense considering most developed economies are aggressively expanding their sovereign debt.
Last week, the US government sold over $740 billion of Treasury securities, spread over nine auctions.
Of them, $585 billion were Treasury bills with maturities from 4 weeks to 26 weeks, spread over six auctions. Three of these auctions were over $100 billion each. Most of these sales replaced maturing T-bills.
And $157 billion of the auction sales were 3-year and 10-year Treasury notes and 30-year Treasury bonds.
The 10-year notes sold at 4.68%, the highest auction yield since 2007. The 30-year bonds sold at 5.21%, the highest auction yields since 2001.
So, if last week’s softer economic data lowered the probability of a near-term rate hike, why did the long-end Treasury yields go higher at auction ?
Simply, 10 to 30 years is a long time for things to go wrong, for inflation to go haywire, for the fiscal situation of the federal government to deteriorate further, producing a pile-up of new debt to fund it all, and for the debt to become critically unmanageable .
For example, investors who bought 10-year or 30-year bonds at auction in August of 2021 are now holding open losses of over 50% on their investment.
As such, with respect to the longer end of the Treasury curve, we believe that the yield direction narrative has flipped from short-term rate hikes to the fiscal credibility of governments, which is very bullish for hard assets that have no government counterparty risk.
Separately, In terms of trade volumes and market participation, the first two weeks of August are the second slowest period of time on the calendar; behind the last two weeks of December.
This is important as institutions and investors often use the slow period in early August to decide where to allocate their money going into the second half of the year.
During the first two weeks of August, Gold and Silver denominated in both AUD and USD gained between 5.8% and 11.2%, which is respectable for a quiet market environment.
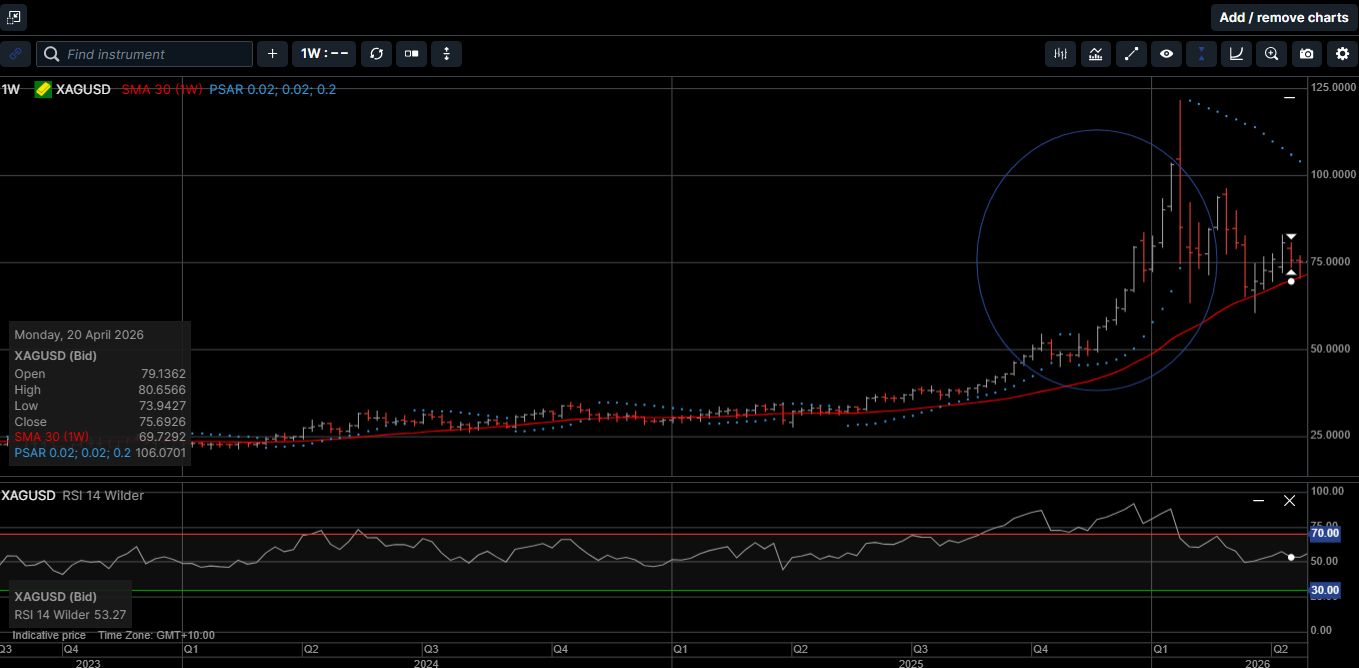
However, as shown on Chart 2, from September 1st to December 20th last year, USD Silver returned an eye-watering 93.4%.
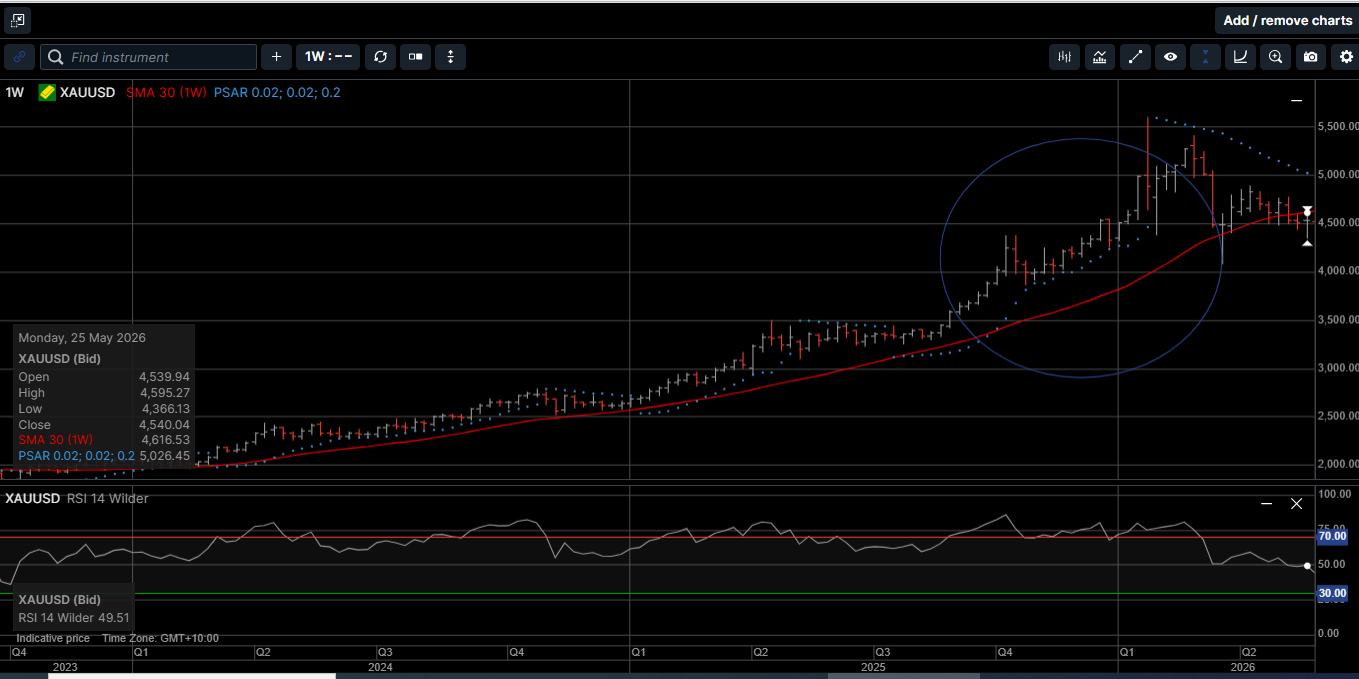
And as shown on Chart 3, USD Gold posted a robust gain of 31.5%. Rounding out the metals: AUD Silver gained 73.5%, AUD Gold gained 23.4% , and Platinum returned 77.6%.
During this same period of time, the SP 500 posted a gain of 7.5%.
Very few assets outperformed the precious metals complex during the last five months of 2025.
From a technical perspective the prices traded for Gold, Silver and Platinum in early July look to be durable lows.
From a fundamental point of view, interest rates and the USD are likely to trend lower; global deficits and debt servicing levels will definitely go higher, and the geopolitical environment will probably remain unsettled.
Against this backdrop, Gold, Silver and Platinum will continue to represent a time-proven store of value and offer security and liquidity for individual wealth.
As the Northern hemisphere summer draws to a close, now is the time to consider rotating out of risky, nonperforming paper assets and increasing your ounces of precious metals as the cornerstone asset in your long-term wealth creation strategy.
This publication has been prepared for the GBA Group Companies. It is for education purposes only and should not be considered either general of personal advice. It does not consider any particular person’s investment objectives, financial situation, or needs. Accordingly, no recommendation (expressed or implied) or other information contained in this report should be acted upon without the appropriateness of that information having regard to those factors. You should assess whether or not the information contained herein is appropriate to your individual financial circumstances and goals before making an investment decision or seek the help the of a licensed financial adviser. Performance is historical; performance may vary; past performance is not necessarily indicative of future performance. Any prices, quotes or statistics included have been obtained from sources deemed to be reliable, but we do not guarantee their accuracy or completeness.