The FOMC Keeps Rates Unchanged
As the month of July draws to a close, the precious metals complex remains in the accumulation phase near technical resistance levels.
Prices got a boost after the Federal Open Market Committee (FOMC) decided to leave the FED Funds rate unchanged on Wednesday, and from the weaker-than-expected US GDP report on Thursday.
The net result from a monetary policy perspective is that the FED Funds target rate will likely stay in the current 3.50% to 3.75% range for the foreseeable future, which is bullish for physical Gold, Silver and Platinum prices.
Physical Gold priced in USD traded above the 30-Day Moving Average (30-DMA) during four of the last five trading sessions but closed the week fractionally lower at $4043.00.
We see initial support just above $3950.00. The daily Relative Strength Index (RSI) is nudging higher at 45.50 and a close above $4090.00 would suggest range extension higher.
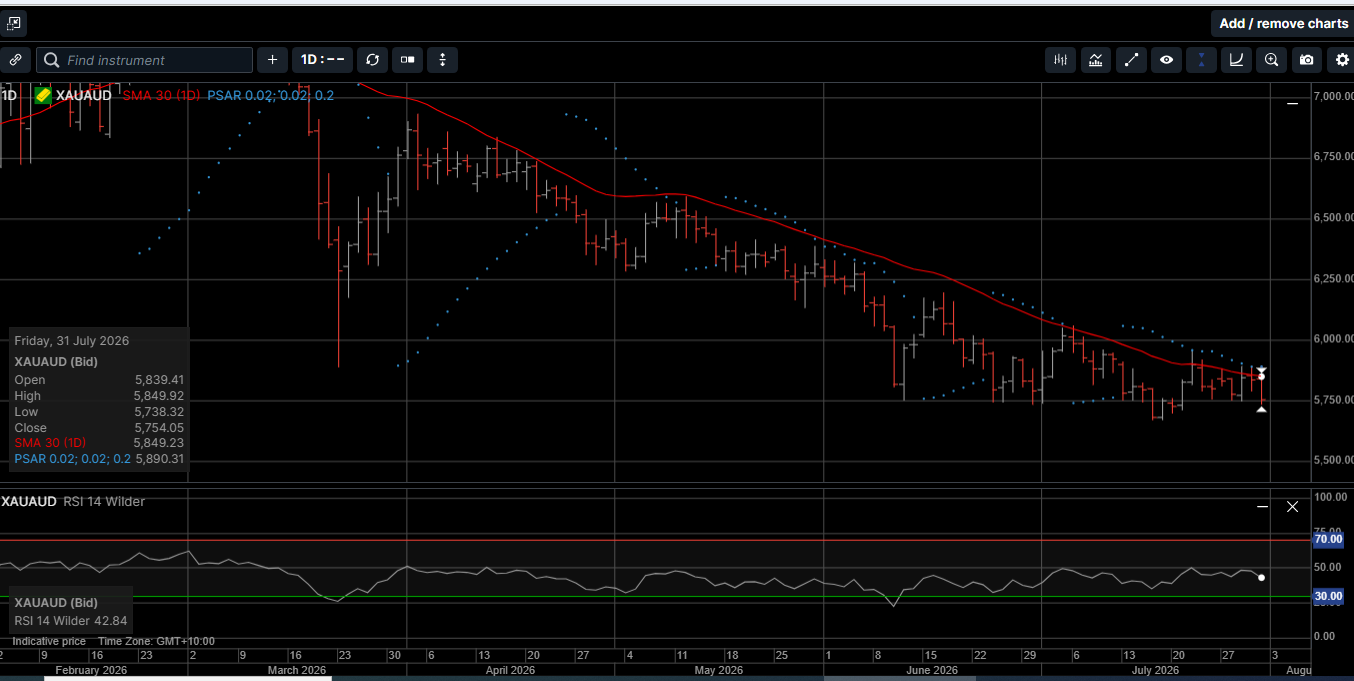
Gold denominated in AUD slipped 1.0% lower into the weekend and closed at $5755.00. The $5740.00 level has acted as a bullish pivot point six times since June 12th.
The 30-DMA is just above $5850.00, and the RSI is at 43.00 and rising.
Physical Silver priced in USD tagged the 30-DMA during four of the last five trading sessions but drifted lower to finish the week 1.1% lower at $57.60.
The daily RSI is 43.60 and pointing higher, while the 30-DMA at $59.30 looks to be within reach this week. A close above $61.20 would suggest a durable low is in place.
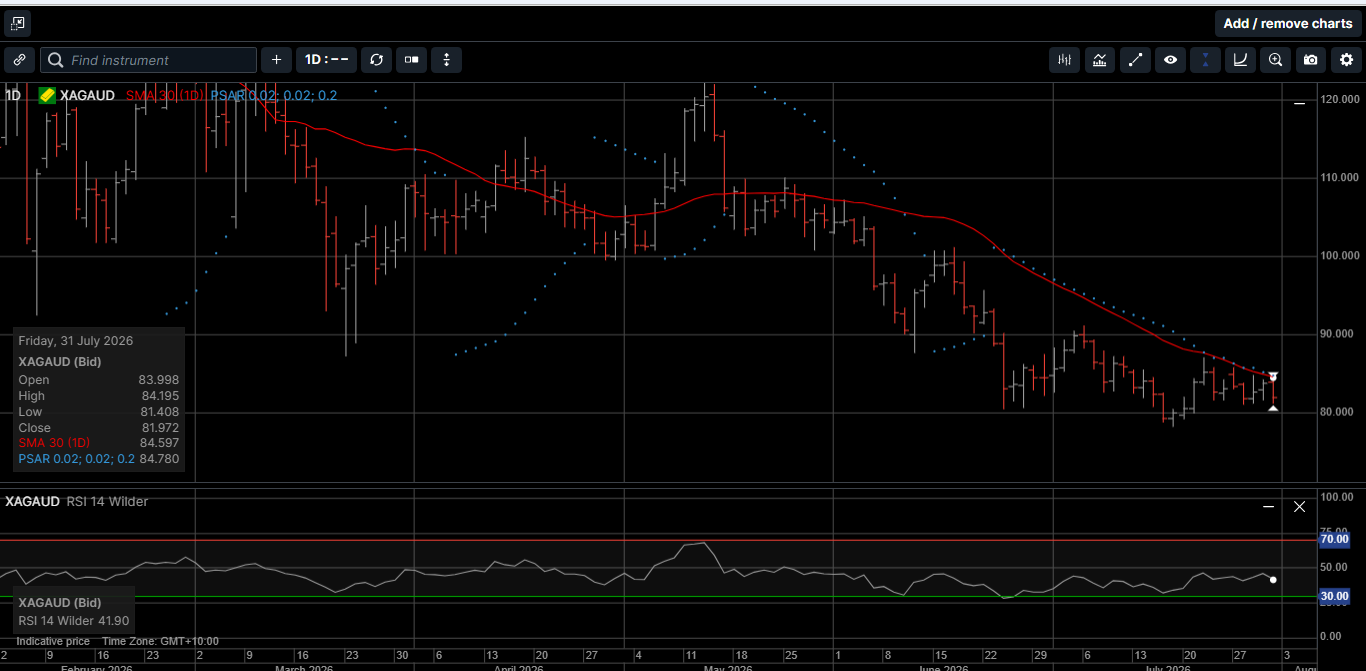
Silver denominated in AUD traded in a relatively narrow range and closed the week 1.3% lower at $81.95. The daily RSI is showing a neutral reading at 42.00, but the 30-DMA at $84.60 looks to be within striking distance this week.
The Gold versus Silver ratio rose by 1.0% in favor of Gold and closed at 70.05. That means it takes 70.05 ounces of Gold to equal the price of one ounce of Gold.
We prefer the short side of this ratio and expect the price to fall to 65.00 as Silver outperforms Gold over the medium term.
Physical Platinum posted its first daily close above the 30-DMA since May 8th and settled almost 1.0% higher for the week at $1643.00.
The daily RSI is above 50.00 for the first time since May 14th. Initial support is at the double bottom near $1570.00, and the next upside target is in the $1735.00 to $1750.00 range.
Last week’s FOMC decision stirred up the inflation debate and how the bond reaction could impact the financial markets around the world.
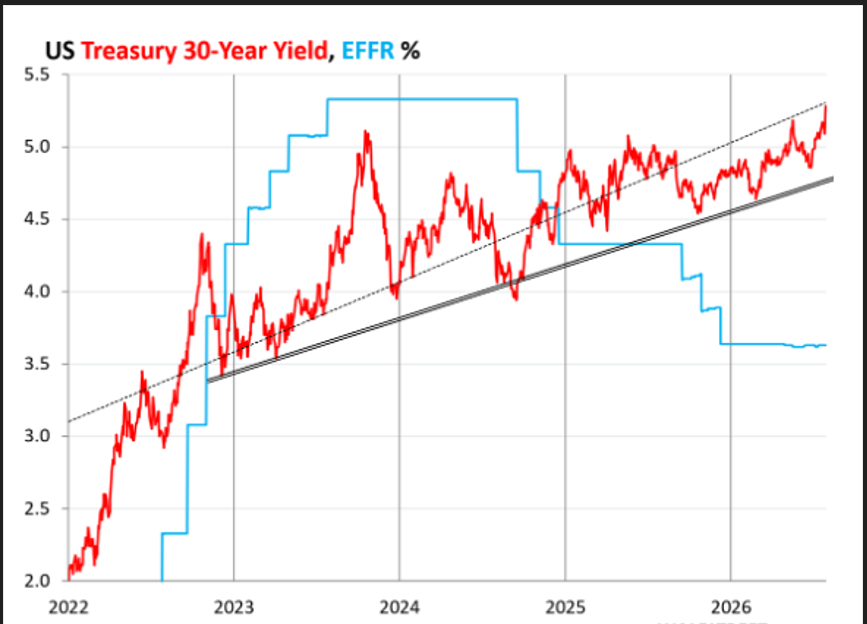
As illustrated on Chart 1, the 30-year Treasury yield jumped by seven basis points on Friday, and by 12 basis points during the week, to 5.28%, the highest since July 2006.
The 30-year yield is now 165 basis points above the Effective Federal Funds Rate (EFFR, blue on Chart 1).
This is historically a very widespread between these two rates and not sustainable.
During the FOMC press conference last Wednesday, FED Chief Kevin Warsh repeatedly said that ending “forward guidance” by the central bank was working, and that Treasury yields had already moved higher since the FOMC meeting in June.
In other words, Mr. Warsh believes that the bond market was raising rates so that the FED did not have to lift the FED Funds rate.
This is a risky stance with respect to paper assets in general, and Treasury-backed fixed income investments, specifically.
The bear market in bonds over the last four years has been a bloodbath, triggering the collapse of several regional banks in 2023 that had loaded up on long-term Treasuries and government-guaranteed Mortgage-Backed Securities (MBS) in 2020 and 2021.
These banks believed the FED’s forward guidance that interest-rate repression via Quantitative Easing (QE) would continue for a long time.
But the forward guidance plan changed.
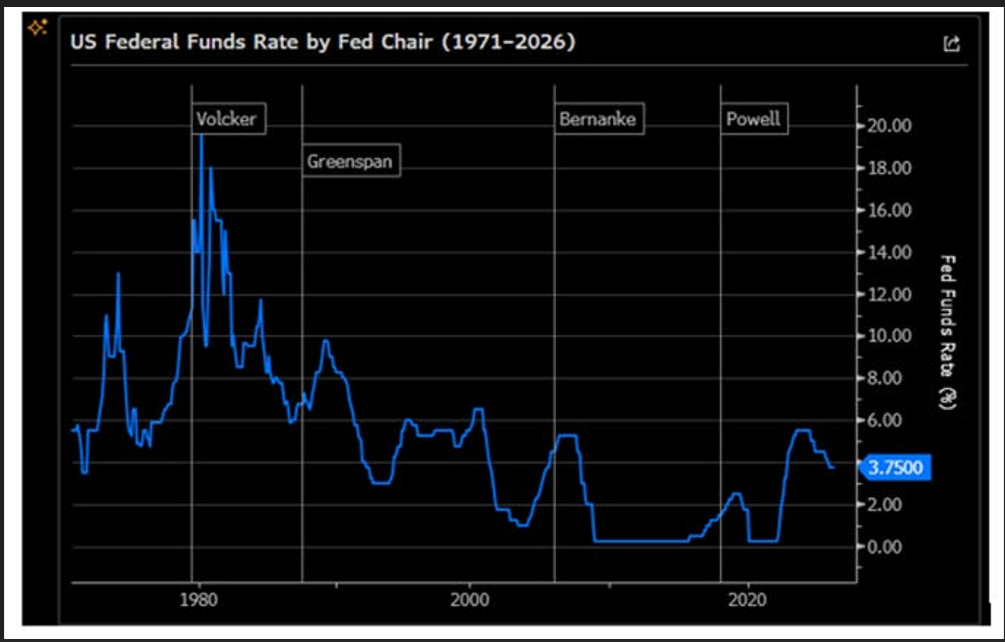
As shown on Chart 2, the FED ended QE in late 2021, raised the FED Funds rates, and started Quantitative Tightening (QT) in 2022.
As a result, long-term yields have climbed rapidly, and the market prices of the long-term bonds that the banks had purchased a couple of years earlier have collapsed.
In fact, the market value of 10-year and 30-year Treasury bonds that the US government sold at auction in mid-2020 have plunged by about 50%.
Let that sink in for a minute.
And then think about how many regional banks might be on the brink of collapse because their bond assets are no longer worth enough to cover their capital ratio requirements.
It’s worth noting that many commentators consider the regional bank failures in March of 2023 to be the initial catalyst for the strong rally in the precious metals over the last three years.
Against that backdrop, the FOMC must also consider the US fiscal position when formulation monetary policy.
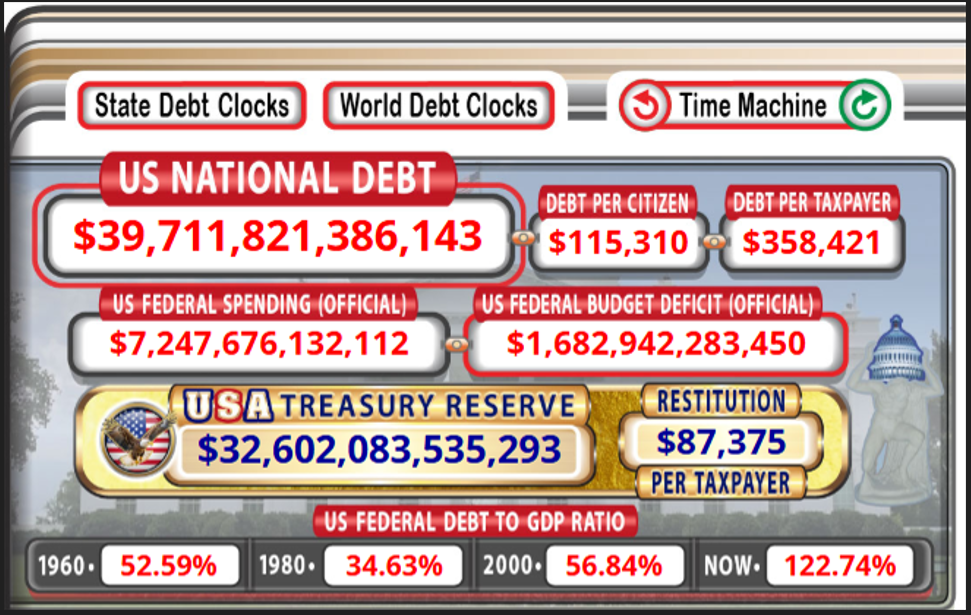
As shown on Chart 3, the US debt will likely break above $40 trillion before the end of 2026, which means about 50% of all new borrowing will be earmarked to paying interest on the debt.
It is difficult to see a protracted rate hike cycle in this fiscal environment.
During the month of July, WTI Crude Oil prices rose by over 27%, which was the biggest monthly jump in over 30 years and contributed to the highest long-end treasury yields since 2006.
Despite these fundamental headwinds, the precious metals complex remained remarkably resilient.
Rather than collapsing under pressure, physical Gold, Silver and Platinum all held above key support levels, with Gold finishing July fractionally higher, Silver 1.5% lower and Platinum 4.2% higher.
As the world’s developed economies continue to pile up debt within an uncertain geopolitical environment, the strategy of holding a large concentration of paper assets becomes riskier and untenable.
Hard assets have a long-established track record as a store of value and providing wealth security.
Since the US FED implicitly ruled out the commencement of a near-term rate hike cycle last week, now is the time to consider adding to your holdings of physical Gold, Silver and Platinum as part of your long-term investment strategy.
This publication has been prepared for the GBA Group Companies. It is for education purposes only and should not be considered either general of personal advice. It does not consider any particular person’s investment objectives, financial situation, or needs. Accordingly, no recommendation (expressed or implied) or other information contained in this report should be acted upon without the appropriateness of that information having regard to those factors. You should assess whether or not the information contained herein is appropriate to your individual financial circumstances and goals before making an investment decision or seek the help the of a licensed financial adviser. Performance is historical; performance may vary; past performance is not necessarily indicative of future performance. Any prices, quotes or statistics included have been obtained from sources deemed to be reliable, but we do not guarantee their accuracy or completeness.