With the US financial markets closed for the Thanksgiving holiday last Thursday, it was reasonable to expect quiet trade into the back half of last week.
This was not the case in the precious metals complex.
Dovish comments from FED officials regarding a rate cut in December combined with rising concerns about shortages of physical metal sparked strong rallies in Gold, Silver and Platinum.
Physical Gold priced in USD cracked the $4200.00 handle to post its highest weekly close since mid-October. The yellow metal picked up 3.8% and closed firmly at $4219.00.
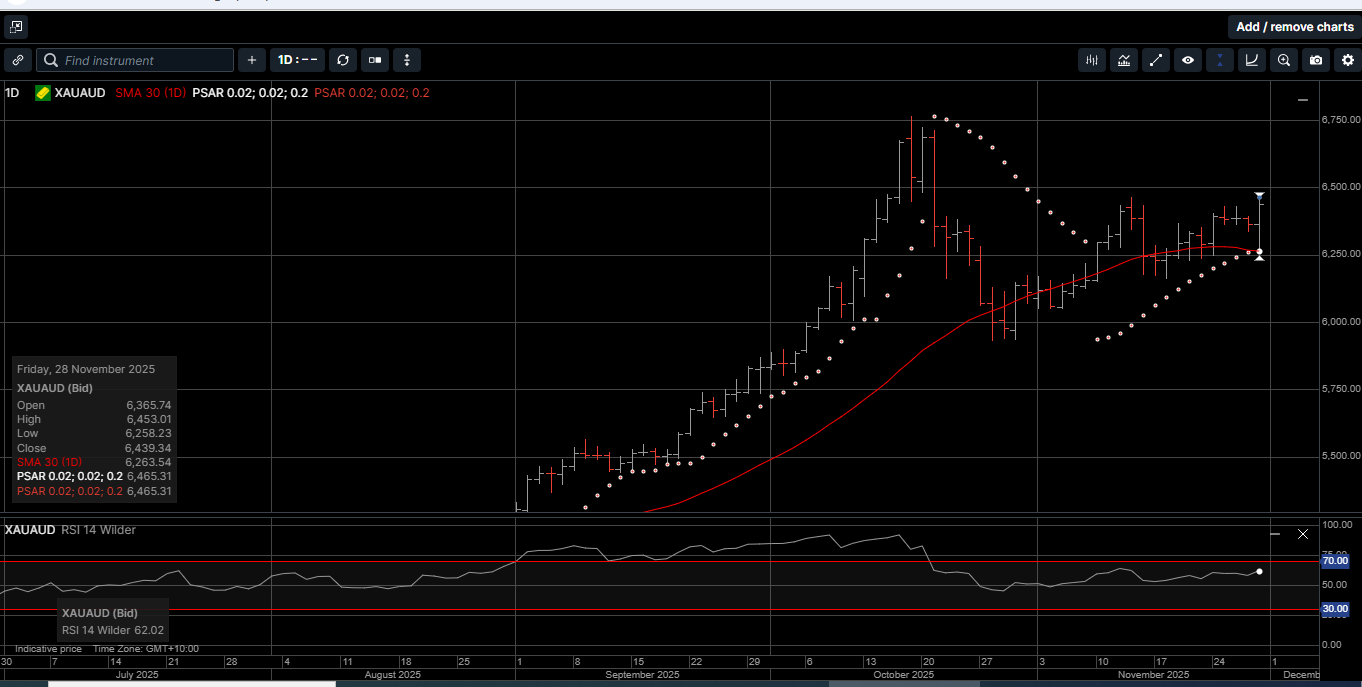
Gold denominated in AUD reached a three-week high at $6453.00 and finished the week 2.5% higher at $6440.00.
The Relative Strength Index (RSI) for Gold in both currencies is pointing higher but still below 70.00, which suggests these markets are not overbought, and the path of least resistance is higher.
Physical Silver based in USD traded higher every day last week and hit a new all-time high at $56.53, which eclipsed the previous all-time high of $54.47 set on October 17th.
USD Silver finished the week up a whopping 12.8% near the high at $56.42.
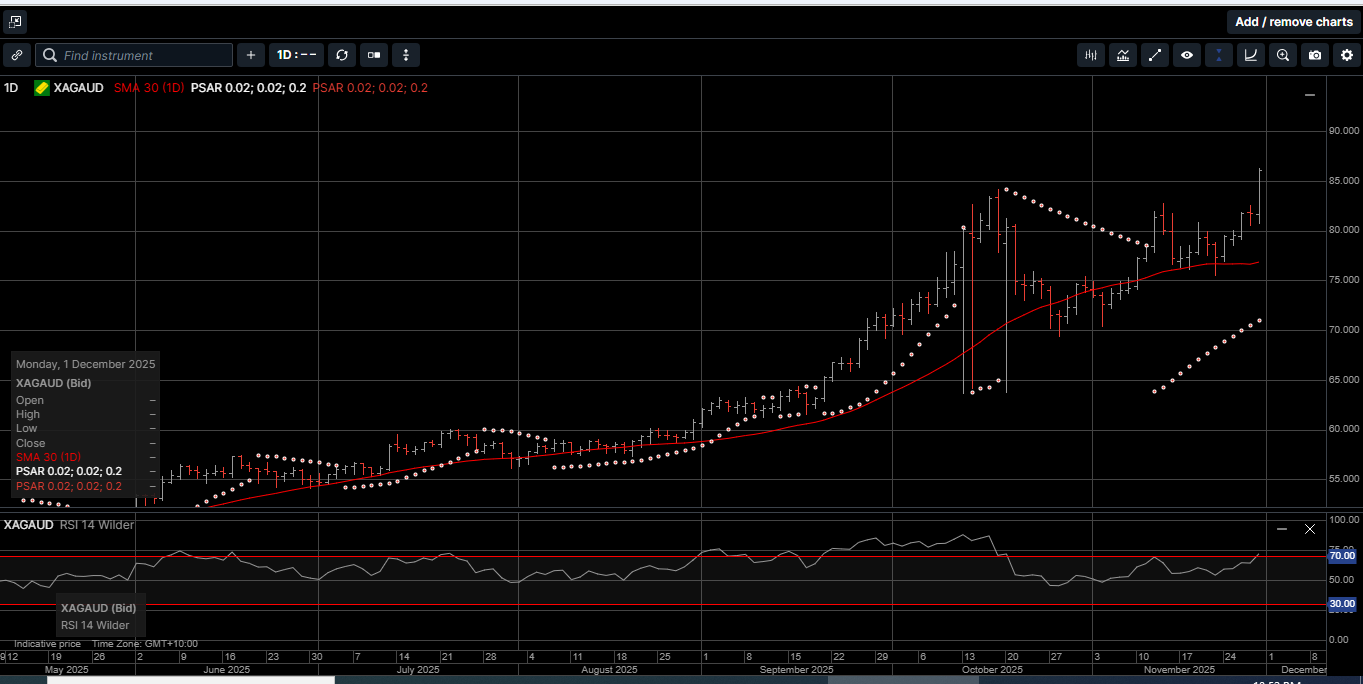
Silver denominated in AUD also posted a new all-time high at $86.30, which is 2.6% higher than the previous high of $84.15 reached on October 17th. For the week, AUD Silver rose 11.3% and closed at $86.05.
Considering the proximity of the weekly closing prices to the highs of the week, we would not be surprised to see a firm start this week and new highs.
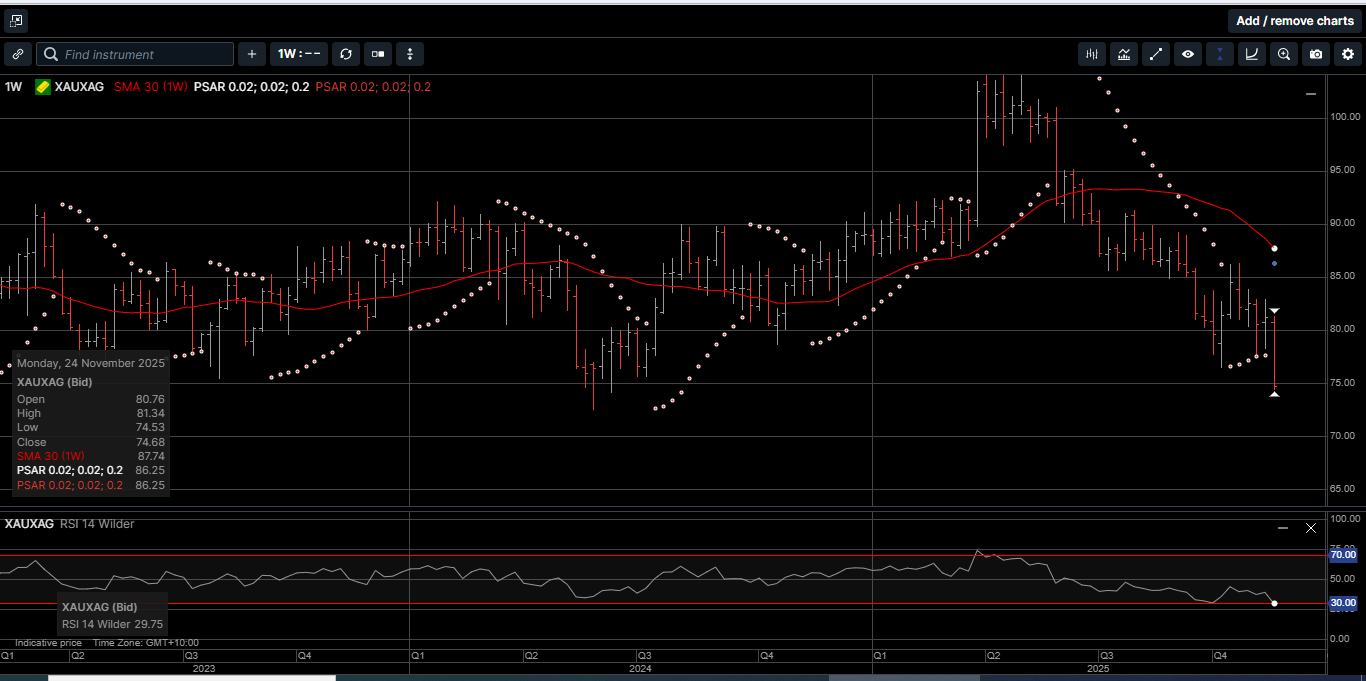
The physical Gold versus Silver ratio had one of its biggest weeks of the year, moved 8.1% lower in favor of Silver and hit an 18-month low of 74.53. This means it takes 74.53 ounces of Silver to equal the price of one ounce of Gold.
Chart 1 Gold vs Silver ratio
As illustrated on Chart 1, since trading as high as 107.15 on April 22nd, the ratio has been on a well-defined downtrend and has moved more than 30% in favor of Silver.
Extending the trend into the medium term, the ratio could return to its historic average band between 50.00 and 60.00.
If that is the case, when Gold reaches the next forecasted resistance area near $4800.00, and the ratio is at 60.00, the price of physical Silver would hit $80.00.
Physical Platinum broke out of its month-long Flag pattern and finished the week with a bullish tone at $1670.00. The next upside target is the October 16th double top at $1725.00.
With the daily RSI at 65.00 and pointing higher, there appears to be more upside potential than downside risk over the medium-term.
Even investors with a casual interest in the market would understand that the precious metals complex has experienced unprecedented volatility, with Gold, Silver and Platinum undergoing dramatic price swings that have reshaped investor expectations.
These developments signal a fundamental shift in how physical metals are valued against traditional paper-based trading futures, marking what many analysts are calling a potential physical metal squeeze.
A critical development has emerged in the form of backwardation across precious metals markets, where immediate delivery prices exceed future contract values. This unusual pricing structure indicates growing demand for physical possession over speculative paper positions.
The backwardation phenomenon, observable in Gold, Silver, and Platinum markets since January, represents a significant departure from typical market structure.
Under normal market conditions, future delivery contracts trade at premiums to physical prices to account for storage costs and financing expenses.
With respect to Gold, central bank purchasing patterns reveal a multi-year trend that began in 2005, with significant acceleration occurring over the past four years. This institutional demand creates a consistent bid beneath the market, providing fundamental price support in the physical market relative to the forward paper contracts.
The World Gold Council reported that central bank Gold purchases reached 1100 tons in 2024, representing the highest annual total in over five decades. Key purchasers included emerging market central banks seeking to reduce dependence on dollar-denominated reserves.
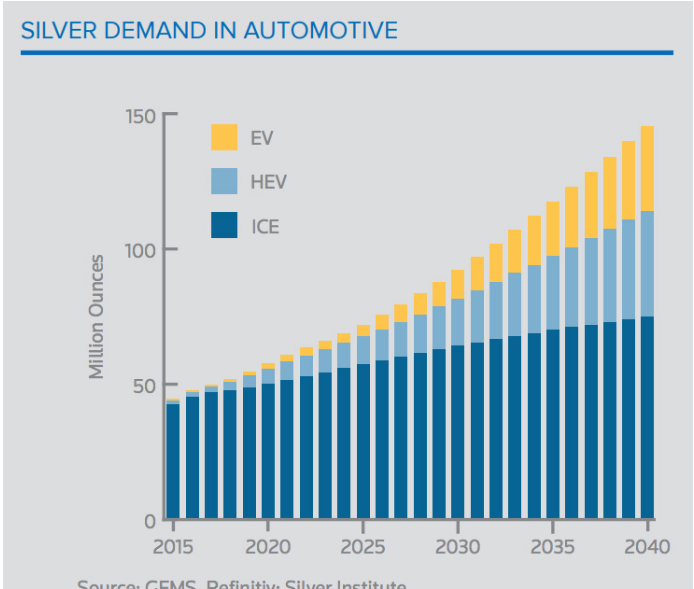
Chart 2 AutomotiveChart 3 Solar Industry Silver
As shown on Charts 2 and 3, Silver’s industrial applications have expanded significantly, particularly within renewable energy infrastructure and automotive electrification. This fundamental demand shift creates supply constraints that traditional mining operations struggle to address quickly.
The United States Geological Survey data indicates that industrial Silver consumption accounts for approximately 60% of total annual demand, with photovoltaic applications representing the fastest-growing segment.
Electric vehicle production requires substantially more Silver content than traditional vehicles, creating additional demand pressure during a market condition that sees Silver consumption outpacing new supply for the fifth consecutive year.
With demand surging and no easy supply fix in sight, it is reasonable to consider Silver’s newfound strength relative to Gold may be more than just a short-term burst.
Last week’s price action put an exclamation point on the fact that very few assets have outperformed the precious metals complex this year.
Precious metals are hard assets, and provident; long-term investors understand that hard assets increase personal wealth security, especially during times of economic uncertainty.
Now is the time to consider adding more physical Gold, Silver and Platinum to your diversified wealth creation strategy.
Chart 4 Gold AUDChart 5 Silver AUD
This publication has been prepared for the GBA Group Companies. It is for education purposes only and should not be considered either general of personal advice. It does not consider any particular person’s investment objectives, financial situation or needs. Accordingly, no recommendation (expressed or implied) or other information contained in this report should be acted upon without the appropriateness of that information having regard to those factors. You should assess whether or not the information contained herein is appropriate to your individual financial circumstances and goals before making an investment decision, or seek the help the of a licensed financial adviser. Performance is historical, performance may vary, past performance is not necessarily indicative of future performance. Any prices, quotes or statistics included have been obtained from sources deemed to be reliable, but we do not guarantee their accuracy or completeness.
Share This Article
If you would like to stay informed about up to the minute pricing, market news and specials, subscribe here.