Hard Assets Firm Despite FED Policy Shift
by Mitchell Tomlinson
Posted on 17 Nov, 2025 in
The precious metals raced higher at the beginning of last week before giving back substantial gains by the close of business on Friday.
The consensus reasoning for the reversal stems from comments by US FED officials suggesting the central bank may leave interest rates unchanged at their next FOMC meeting in December.
This potential backflip of policy put downside pressure on risk assets during the back half of the week.
Interestingly, as the sentiment for another FED Funds rate cut cools, the chatter of a US liquidity squeeze into the end of the year has increased.
In the past, the FED’s “go to” plan to inject immediate liquidity into the banking system involves Quantitative Easing (QE); which is bullish for Gold, Silver and Platinum prices.
Physical Gold priced in USD traded in a 6.8% weekly range and hit a one-month high of $4245.00 before slipping lower into the weekend to close 2.1% higher at $4084.
The yellow metal held above the 30-Day Moving Average (DMA) every day last week, which suggests the corrective phase has run its course. Only a break of $3945.00 would reverse the bullish technical outlook.
Gold denominated in AUD followed a similar pattern with a 5.8% trading range and a closing price 1.4% higher at $6246.00.
Physical Silver priced in USD traded in a 13.6% range and came within a whisker of posting a new all-time high at $54.40, before reverting lower to finish the week with a 4.6% gain at $50.60.
USD Silver traded above the 30 DMA every day last week, which suggests the corrective phase is over and solid support is in the $46.50 to $47.00 area.
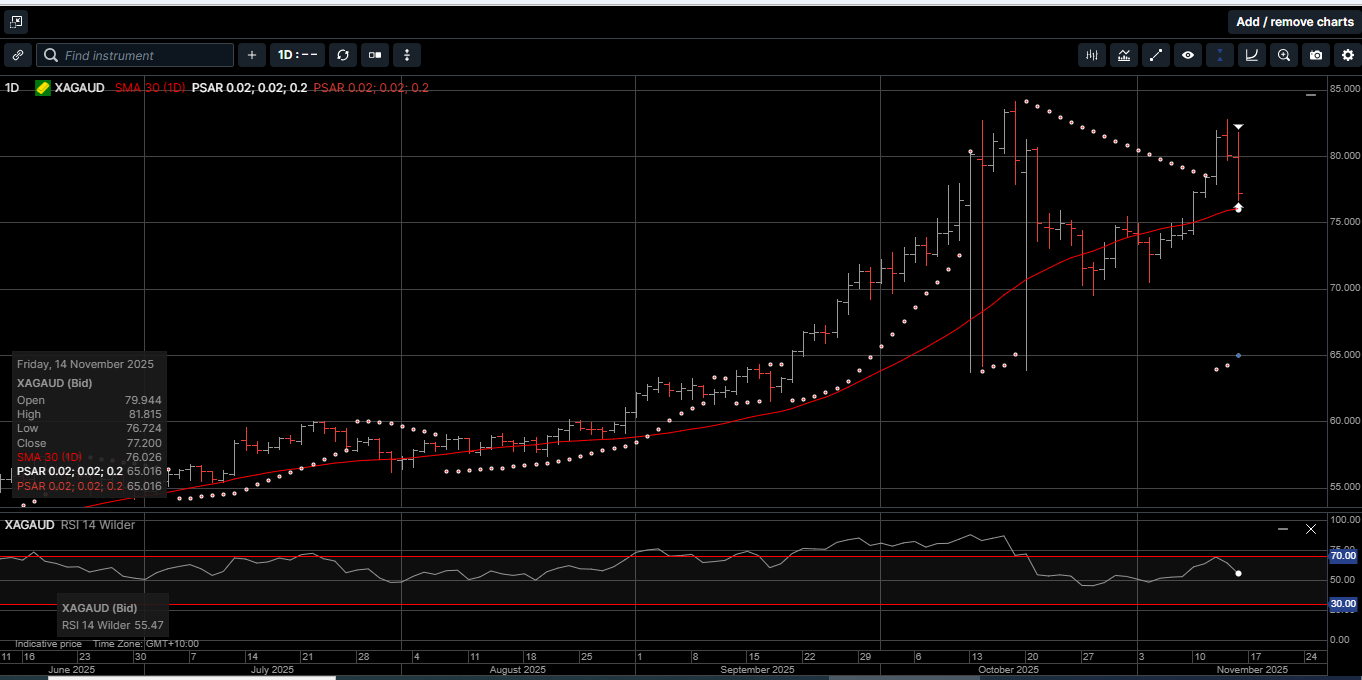
Silver denominated in AUD failed to reach the $83.00 handle but still finished the week with a positive chart structure and a strong 3.8% gain at $77.20.
The Gold versus Silver ratio moved 2.4% lower in favour of Silver and closed at 80.55. This means it takes 80.55 ounces of Silver to equal the price of one ounce of Gold.
Physical Platinum reached a five-week high of $1630.00 before sliding lower to finish the week fractionally higher at $1545.00.
From a technical perspective, Platinum looks to be carving out a pennant formation between $1500 and $1620, which suggests more price consolidation over the near-term.
On balance, even though the precious metals finished the week well off their best levels, the increased concerns about US funding pressure is another bullish fundamental to build upside momentum over the longer-term.
Most investors will look at Chart 1 and see four random data sets. Fund managers and central bankers look at Chart 1 and see a problem growing in the US Repo market.
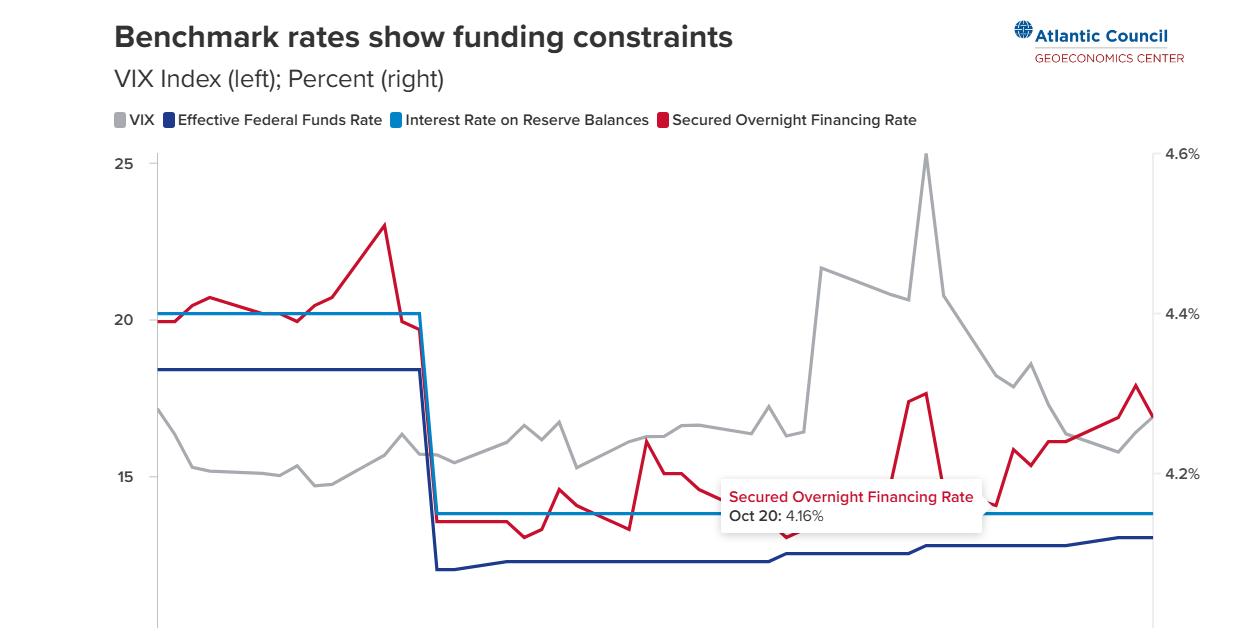
They see the same problem they saw in 2009, 2019 and 2021, and it seems that QE will soon be back in play.
Back in 2010, FED chief Ben Bernanke sat before Congress and assured everyone that Quantitative Easing was “temporary” and would be “reversed” once the emergency had passed.
QE was supposed to be a short-lived anomaly, a controlled detour from the strict monetary discipline within the FED’s charter.
The balance sheet would shrink, markets would normalize, and the FED would quietly step back into the shadows.
Here we are fourteen years later.
The detour has become a highway with trillions worth of losing bond positions on the FED’s balance sheet and likely more to come.
At the last FOMC meeting on October 29th, the FED effectively threw in the towel on Quantitative Tightening, announcing that the steady runoff of its asset portfolio will halt.
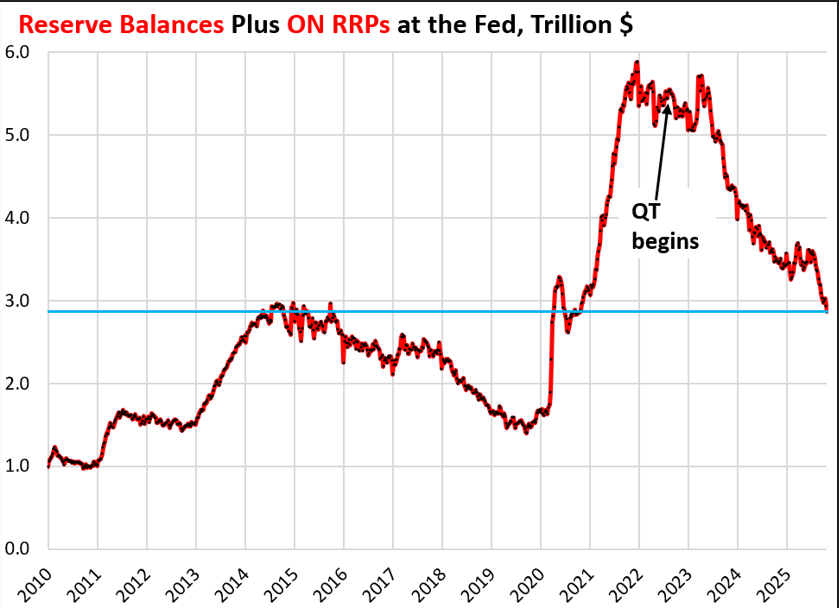
As shown on Chart 2, the FED’s balance sheet reduction has ended.
The same central bank that insisted it could unwind trillions in emergency asset purchases now quietly concedes that those assets are not going anywhere.
Not surprisingly, the largest obstacle to normalization is the FED’s own balance sheet.
The central bank bought trillions of dollars in mortgage-backed securities at ultra-low yields during the COVID-19 pandemic, these securities now sit underwater; the Fed earns roughly 2% on them while paying close to 5% to fund them.
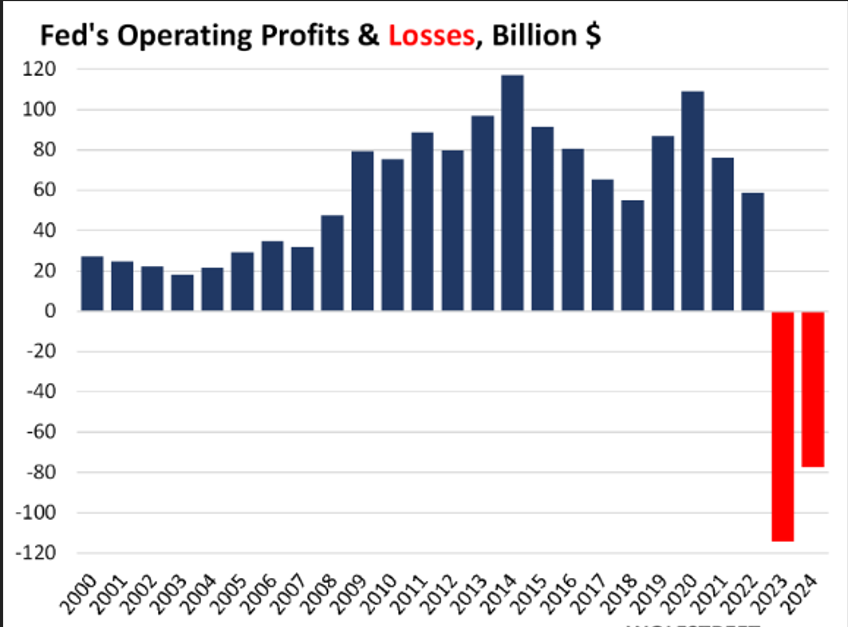
As illustrated on Chart 3, the FED is losing money every single day by holding assets it cannot afford to sell.
The Fed owns nearly 25% of the entire agency mortgage-backed securities market.
If it attempted to liquidate those holdings, mortgage markets would seize up almost immediately, interest rates would spike, home prices would dive, and taxpayers would again take all the losses.
Ending QT last month is the clearest admission yet that the FED has no realistic path back to pre-crisis monetary conditions.
It looks like the FED is trapped between inflation and widespread insolvency.
If they lift rates, their portfolio losses deepen while financial markets buckle.
If they cut rates aggressively inflation revives before the public has forgotten the last round and Wall Street probably grinds lower. .
The uncomfortable truth is that the FED did not merely intervene in markets back in 2010 with QE. The FED became the market.
And once a central bank makes itself the indispensable buyer of last resort for an entire asset class, there is no clean exit.
As such, we continue to prefer assets that do not depend on the FED’s expertise or honesty to maintain their value.
More specifically, when the FED’s balance sheet looks like a leveraged hedge fund’s, and the officials running it appear shocked to discover that duration risk exists, it seems prudent to hold assets with no counterparty risk to the central bank.
Over the last 12 months, there are few assets available to private investors that have outperformed physical Gold, Silver and Platinum.
Now more than ever, hard assets increase your wealth security and represent a store of value in an uncertain economic environment.
Considering that the FED will likely engage in QE again sometime over the next six months, now is the time to consider making Gold, Silver and Platinum the cornerstone assets in your long-term wealth creation strategy.

This publication has been prepared for the GBA Group Companies. It is for education purposes only and should not be considered either general of personal advice. It does not consider any particular person’s investment objectives, financial situation or needs. Accordingly, no recommendation (expressed or implied) or other information contained in this report should be acted upon without the appropriateness of that information having regard to those factors. You should assess whether or not the information contained herein is appropriate to your individual financial circumstances and goals before making an investment decision, or seek the help the of a licensed financial adviser. Performance is historical, performance may vary, past performance is not necessarily indicative of future performance. Any prices, quotes or statistics included have been obtained from sources deemed to be reliable, but we do not guarantee their accuracy or completeness.