Gold, Silver and the F.O.M.O. Trade
Gold, Silver and the F.O.M.O. Trade
The strong rally in the precious metals complex, which began in August after the US FED pivoted to an easing cycle, is now entering its ninth week.
There are several moving pieces to the broad macro story which has led investors to drive Gold and Silver to new all-time highs, and multi-year highs in Platinum.
Some themes that have supported physical metals prices include expectations of lower US rates, a generally weaker USD, growing uncertainty over US trade policy, and now: The Fear Of Missing Out (F.O.M.O.).
Physical Gold priced in USD reached a new all-time high of $4380.00, which at the time was up 9.1% from the previous week’s close of $4017.00.
However, selling pressure into the weekend saw the yellow metal close last Friday at $4250.00, which pencils out to a 5.8% weekly gain.
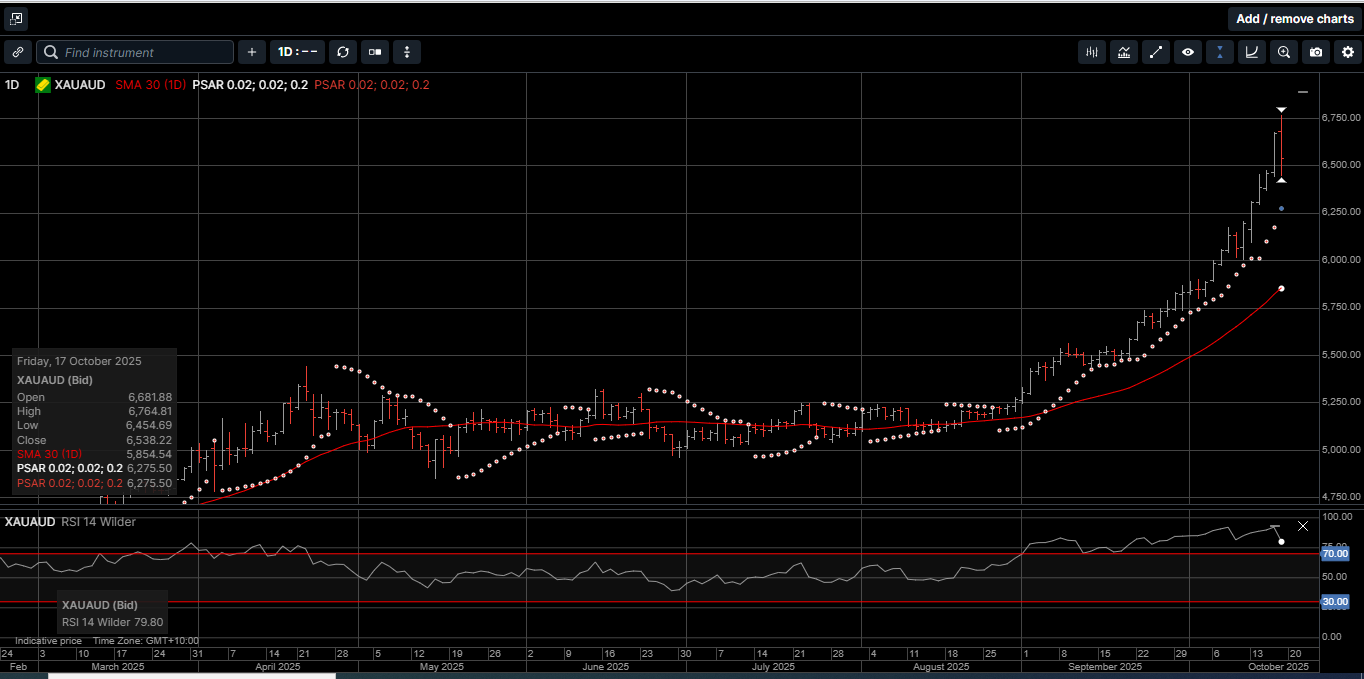
Gold denominated in AUD posted a new all-time high at $6765.00 before sliding lower to finish the week with a 5.6% gain at $6538.00.
Physical Silver based in USD jumped $4.00 higher to hit a new record high at $54.50 but was unable to hold the $54.00 level and closed 3.1% higher at $51.77.
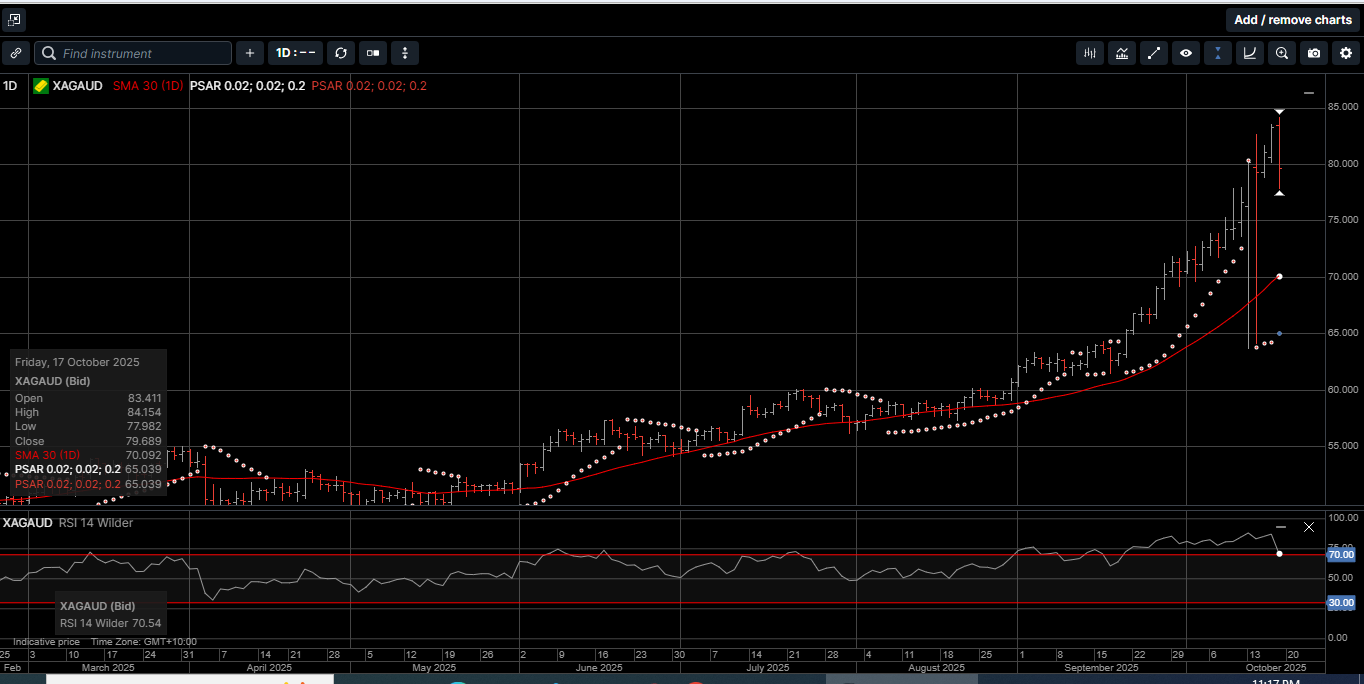
Similar to USD Silver, AUD denominated Silver tagged a new all-time high at $84.15 but slid lower into the weekend to close 4.1% higher at $79.70.
The Gold versus Silver Ratio moved 2.2% in favour of Gold last week to close at 81.43. This means it takes 81.43 ounces of Silver to equal one ounce of Gold.
Physical Platinum hit a 14-year high at $1733.00 and finished the week 2.1% higher at $1620.00.
It’s worth noting that the daily Relative Strength Index (RSI), which is an indicator used to measure oversold (under 30) and overbought (over 70) conditions, has been over 70.00 for Gold, Silver and Platinum for the last 4 weeks.
As such, some high-level price consolidation over the near term would not be a surprise.
As illustrated on Chart 1, the sharp move higher in Gold started on August 22nd (circled area) and accelerated last week.
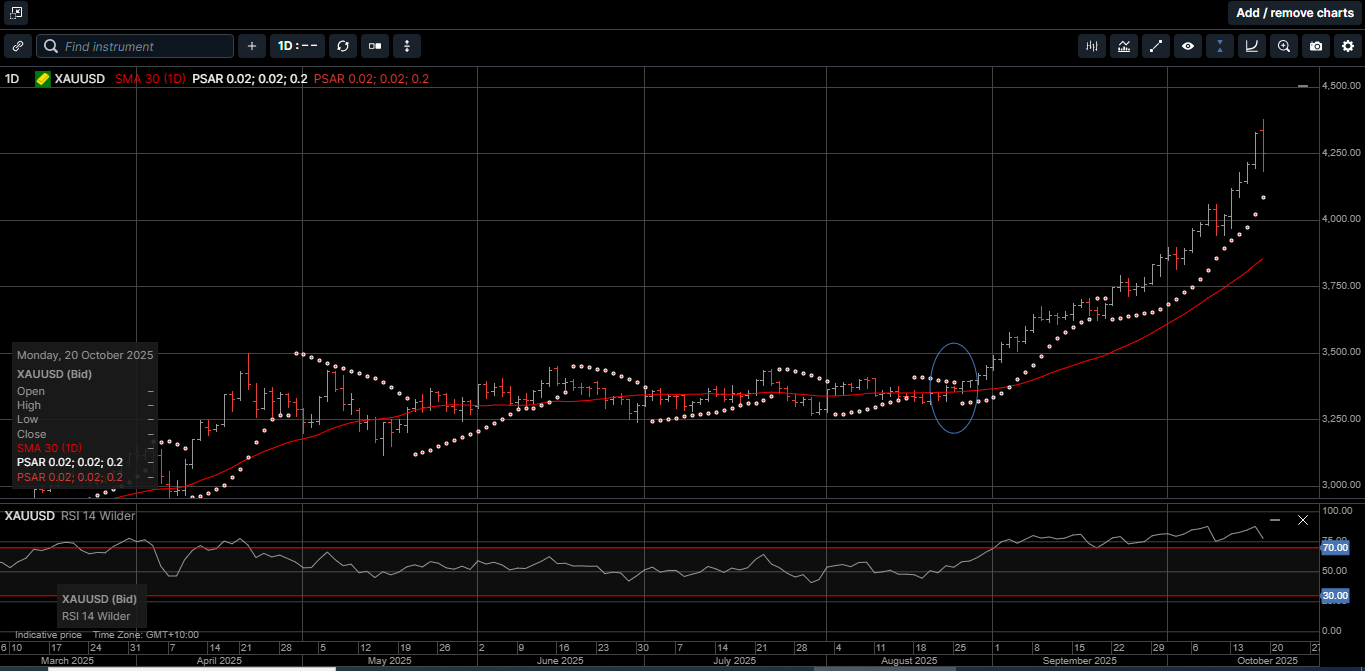
During this time, USD Gold has gained 26.3%, AUD Gold has picked up 25.6%, Platinum has returned 19.6% and Silver in both currencies has risen by just over 30%.
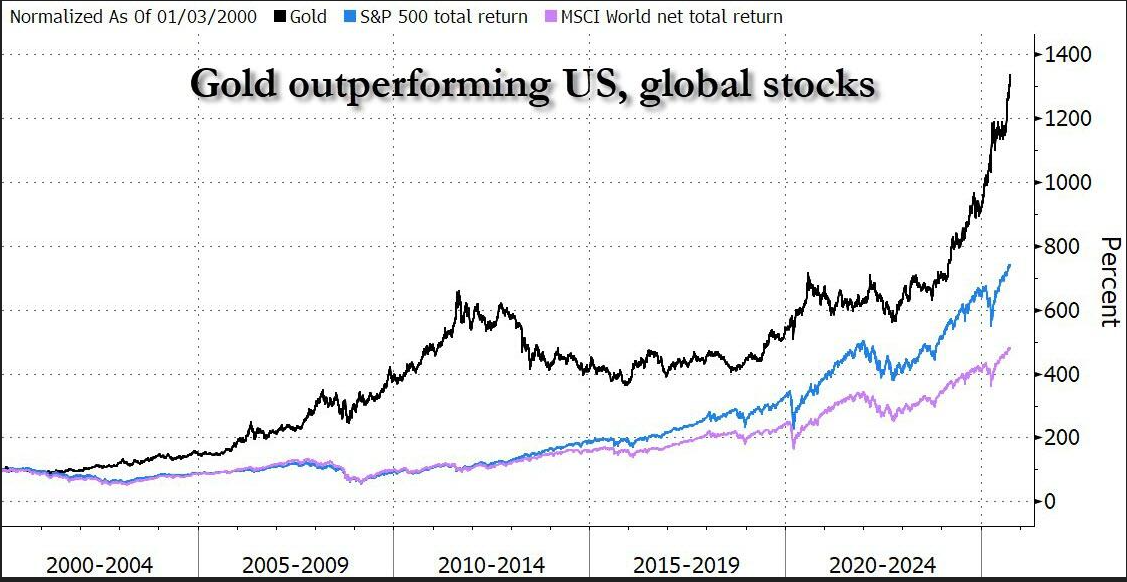
Comparatively, the S&P 500 has only returned 3.5% since August 22nd and a growing number of analysts are concerned about the outlook for US and global equity markets.
In fact, over the last couple of weeks, several Wall Street commentors suggested adjusting their long held 60/40 stock to bond portfolio mix to a 60/20/20 mix with a 20% allocation to precious metals.
Considering that Wall Street has largely ignored the hard asset rally during the last two years, it’s not unreasonable to believe that a “sell equities to buy metals” tactical hedge strategy could act as a catalyst for driving Gold, Silver and Platinum prices higher over a longer-term horizon.
As shown on Chart 2, the S&P 500, along with other US stock indexes, are not only underperforming the precious metals by a large margin, but they are also considered overvalued based on several different metrics.
One of the measures worth following is the level of stock-related margin debt.
As shown on Chart 3, leverage in the stock market has been rising since April.
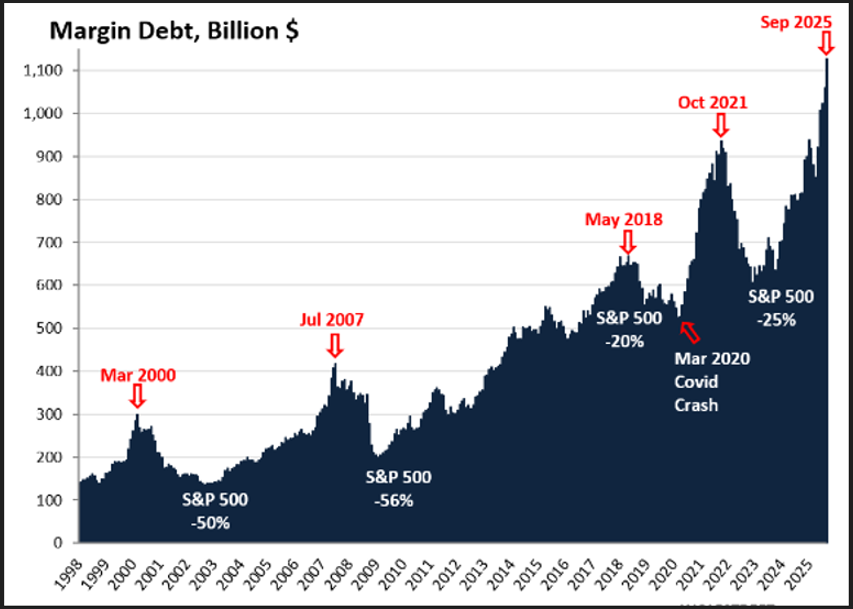
In September, margin debt, which is the amount investors borrowed from their brokers, spiked by another 6.3%, or by $67 billion, from August to a record $1.13 trillion.
Since April, margin debt has risen by 39%, the biggest five-month increase since October 2021.
Remember, it was in early November 2021 that stocks began to sell off sharply with the S&P 500 ultimately dropping by 25%.
Leverage is the great accelerator on the way up, but it’s also the great accelerator on the way down, especially when the margin loans are based on personal stock holdings.
Regularly since 2000, multi-month surges in margin debt, indicate excessive speculation and risk-taking and have invariably led to sharp selloffs:
Referencing Chart 3:
March 2000 was the beginning of the Dotcom Bust, during which the S&P 500 fell by 50% and the Nasdaq by 78%.
July 2007 was just before the stock market started turning into the beginning of the Global Financial Crisis, during which the S&P 500 fell by 56%.
May 2018 was followed by a 20% decline in the S&P 500 by late 2018.
October 2021 led to a 25% decline of the S&P 500.
Overleverage in financial markets can lead to a sharp repricing of paper assets to lower levels very quickly.
The bottom line is that Gold, Silver and Platinum are not rising for one reason; they are rising and outperforming most other assets for many reasons.
Hard assets stand alone as the purest form of money. They provide wealth security and represent a time proven store of value during uncertain economic times.
With the broader market media finally getting on board with the logic of making physical precious metals the cornerstone asset in a wealth creation strategy, we probably have not seen the last of the F.O.M.O. trade.
Now is the time to consider reviewing your paper asset portfolio, divest in the underperformers, and add to your physical Gold, Silver and Platinum holdings.
This publication has been prepared for the GBA Group Companies. It is for education purposes only and should not be considered either general of personal advice. It does not consider any particular person’s investment objectives, financial situation or needs. Accordingly, no recommendation (expressed or implied) or other information contained in this report should be acted upon without the appropriateness of that information having regard to those factors. You should assess whether or not the information contained herein is appropriate to your individual financial circumstances and goals before making an investment decision, or seek the help the of a licensed financial adviser. Performance is historical, performance may vary, past performance is not necessarily indicative of future performance. Any prices, quotes or statistics included have been obtained from sources deemed to be reliable, but we do not guarantee their accuracy or completeness.