Gold and Silver Rally to New All-Time Highs
Gold and Silver Rally to New All-Time Highs
Strong demand for physical precious metals from central banks, institutions and individual investors continues to push prices higher.
And even though the US government shutdown significantly reduced last week’s macroeconomic data flow, forward rate markets are pricing in a 90% chance of another rate cut from the FED at their October 24th meeting.
In general, lower interest rates are a bullish fundamental driver for Gold, Silver, and Platinum prices.
Gold priced in USD broke through the $4000.00 level and raced to a new all-time high of $4060.00 last Wednesday before reversing back to $3940.00 during Thursday’s trading session.
As we have seen in the past, buying interest emerged during the intra-day dip and the yellow metal finished the week with a 3.4% gain at $4017.00.
Gold denominated in AUD cracked the $6200.00 level for the first time ever and closed out the week with an impressive 5.3% gain at $6193.00.
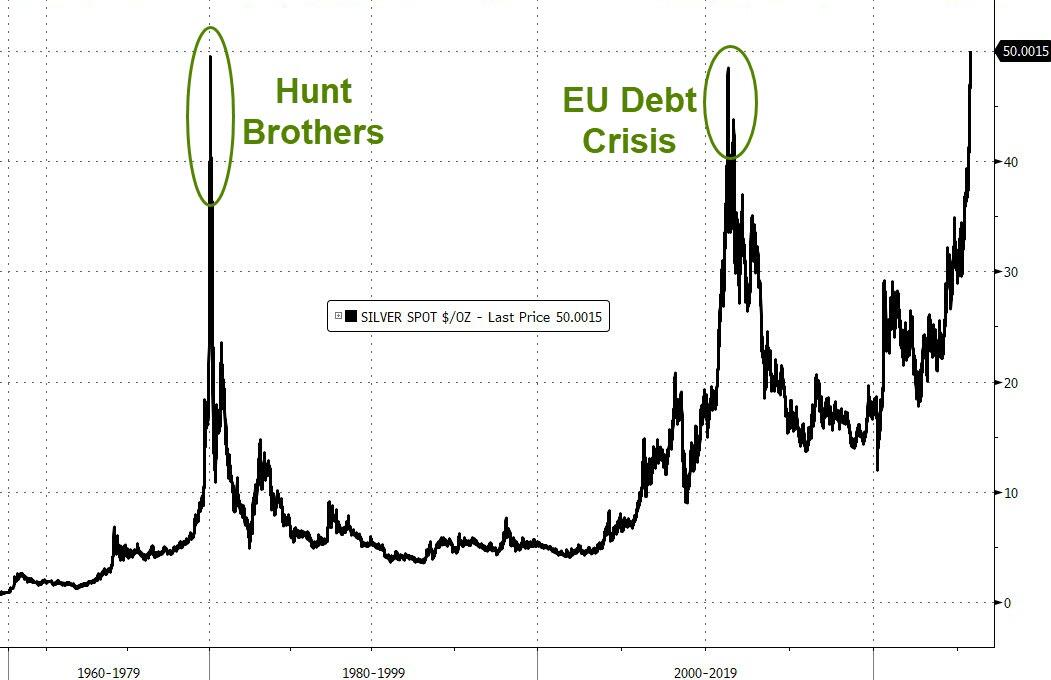
Physical Silver priced in USD finally broke through the January 1980 high of $50.00 and reached a new All-time high of $51.23. Silver finished the week 4.6% higher and a new all-time high close at $50.21.
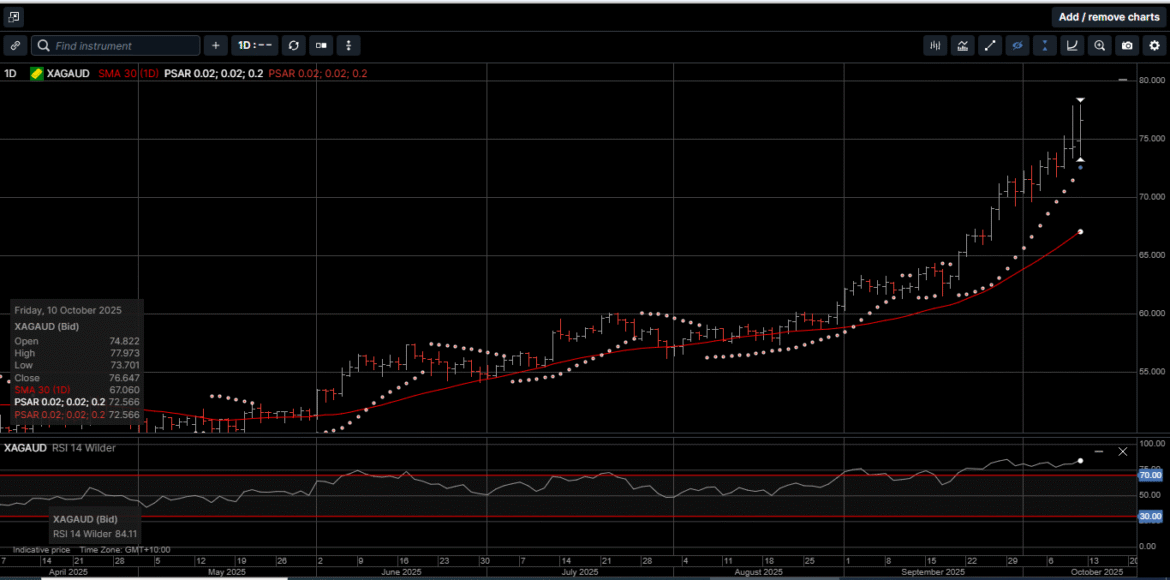
Silver based in AUD came within a whisker of hitting the $78.00 level. Still, AUD Silver posted a new all-time high of $77.97 and closed out the week with a whopping 5.5% gain at $76.65.
Physical Platinum posted a new 12-year high at $1688.00 on Thursday before slipping lower to finish the week fractionally lower at $1601.00.
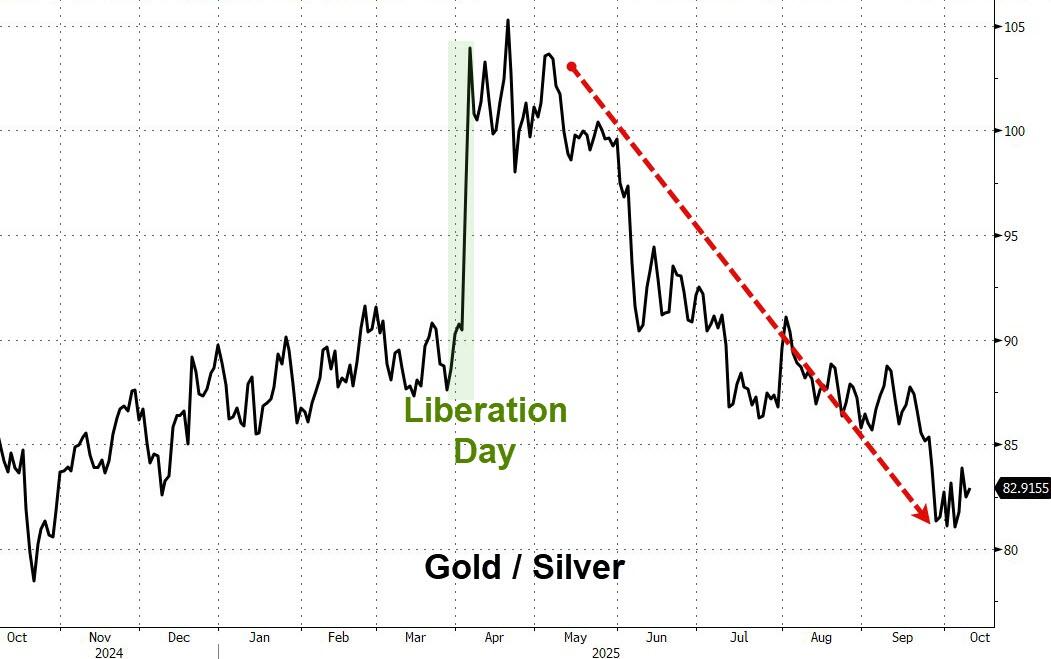
The Gold versus Silver ratio slid 1.2% lower in favor of Silver last week, hit a new 52-week low at 77.83 and closed the week at 79.60. That means it takes 79.60 ounces of Silver to equal the price of one ounce of Gold.
The last few months have seen USD Gold soar to record highs along the lines of the “debasement trade,” with central bankers and investors flocking to the safety of hard assets while pulling away from debt burdened currencies.
However, as illustrated on Chart 1, Silver has outperformed Gold by almost 34% since early April when the US administration announced sweeping trade tariffs.
As shown on Chart 2, Silver’s surge last week takes it back to the January 1980 highs when the Hunt brothers, Texan oil billionaires and notorious speculators, whose belief in the metal as a store of wealth prompted them to stockpile more than 200 million ounces.
Physical Silver is used around the world as an investment asset but also has strategic industrial applications including in solar panels, electric vehicle batteries, and communication satellites , which collectively account for more than half of the Silver sold.
Demand is set to exceed supply for the fifth consecutive year in 2025.
The Silver Institute reported in their latest World Silver Survey that the 2025 supply/demand deficit could exceed 215 million ounces, which would be over 10 million ounces more than the 2024 supply deficit.
This year, fears that the US could levy tariffs on Silver have spurred a dash to ship the metal to the US, drawing down inventories in London and reducing the amount of material available to borrow.
Much of the stock of Silver in London is held in vaults backing exchange-traded funds and is not available to buy or borrow on the market.
From a broad investment perspective, Gold, Silver and Platinum represent a secure store of value and are the purest forms of money.
There are very few assets that have outperformed the precious metals complex this year.
On a year-to-date basis Gold priced in USD and AUD have gained 53% and 46%, respectively.
Silver priced in USD has returned 74% year-to-date, while AUD Silver has risen 64% since the beginning of 2025.
And even though Platinum was slightly lower last week, it is still the best performing metal with a 78% return on a year-to-date basis.
With their immutable physical properties, worldwide recognition as safe havens with no counterparty risk, Gold, Silver and Platinum serve as uniquely effective assets for investors looking for a secure, time-proven long-term wealth creation strategy.
Now is the time to consider reducing exposure to underperforming paper assets and make Gold, Silver and Platinum your cornerstone portfolio assets.
Chart 3 Gold AUD
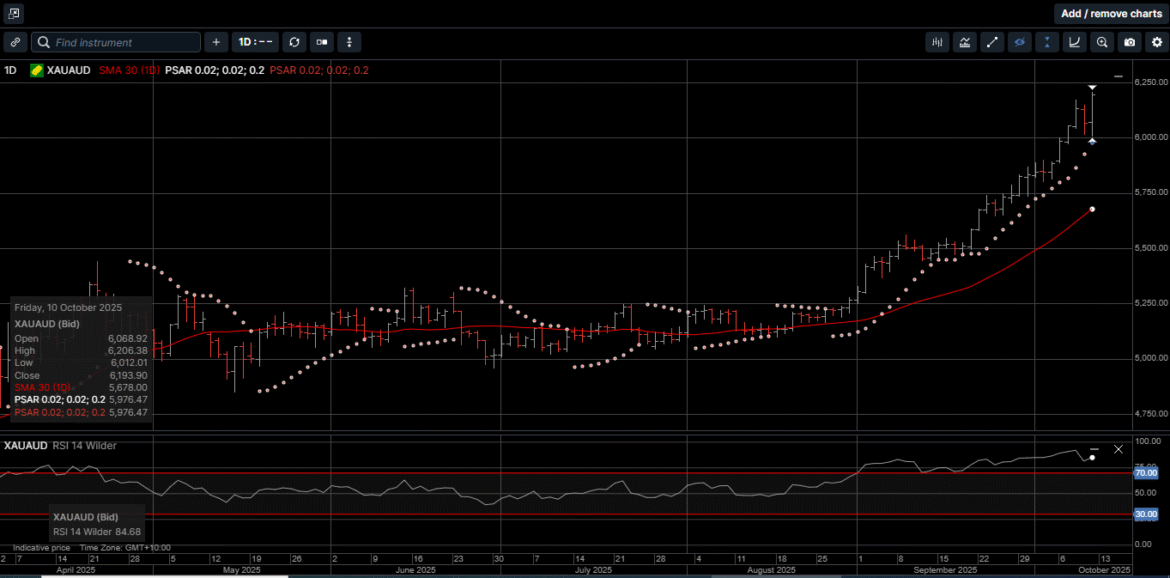
Chart 4 Silver AUD
This publication has been prepared for the GBA Group Companies. It is for education purposes only and should not be considered either general of personal advice. It does not consider any particular person’s investment objectives, financial situation or needs. Accordingly, no recommendation (expressed or implied) or other information contained in this report should be acted upon without the appropriateness of that information having regard to those factors. You should assess whether or not the information contained herein is appropriate to your individual financial circumstances and goals before making an investment decision, or seek the help the of a licensed financial adviser. Performance is historical, performance may vary, past performance is not necessarily indicative of future performance. Any prices, quotes or statistics included have been obtained from sources deemed to be reliable, but we do not guarantee their accuracy or completeness.