Gold Jumps Higher After Dismal US Jobs Report
The precious metals complex started last week under pressure as the USD firmed on the combination of new tariff announcements and the expectations of a “hawkish hold” from the US central bank.
While that was the case, Friday’s unexpectedly weak Non-Farm Payroll (NFP) report hammered the USD lower, increased the odds of a September rate cut and sparked a recovery in Gold, Silver and Platinum prices.
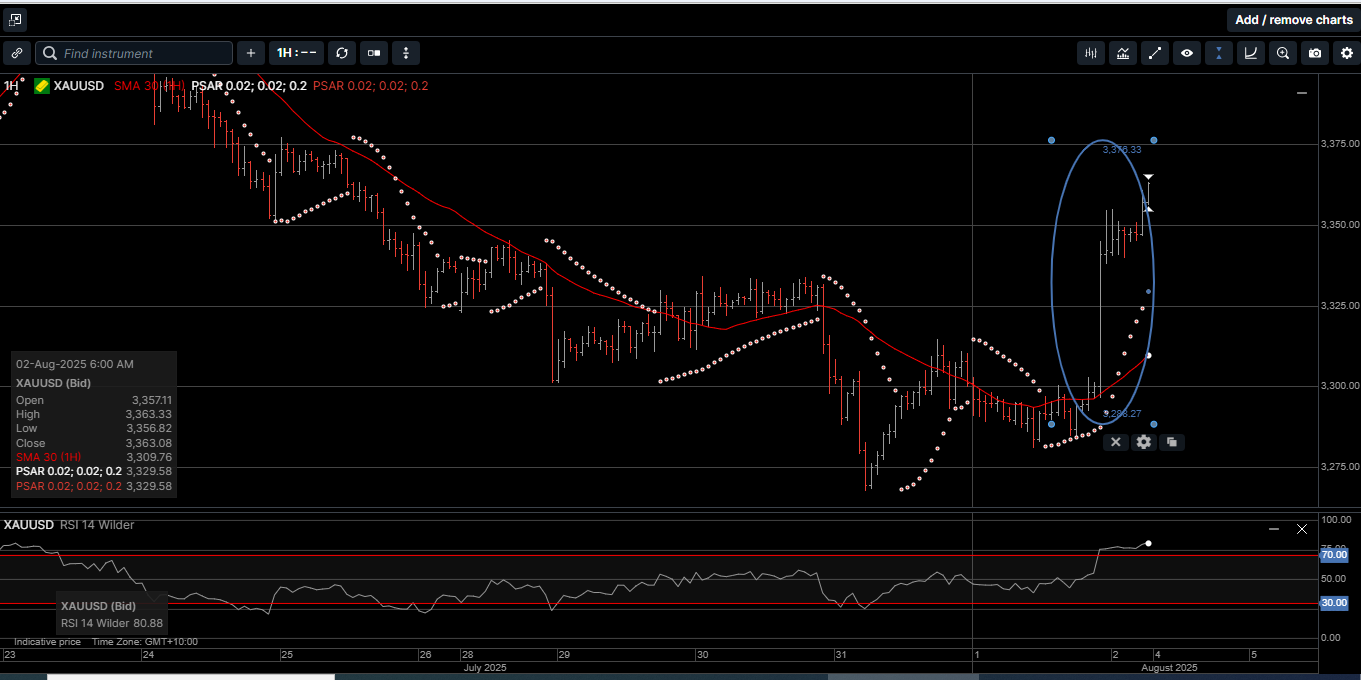
As illustrated on Chart 1, Gold priced in USD surged after the NFP release and posted a 2.4% gain on Friday. For the week, USD Gold recovered from a five-week low at $3265.00 to close 1.1% higher at $3365.00.
Chart 1: USD Gold Hourly
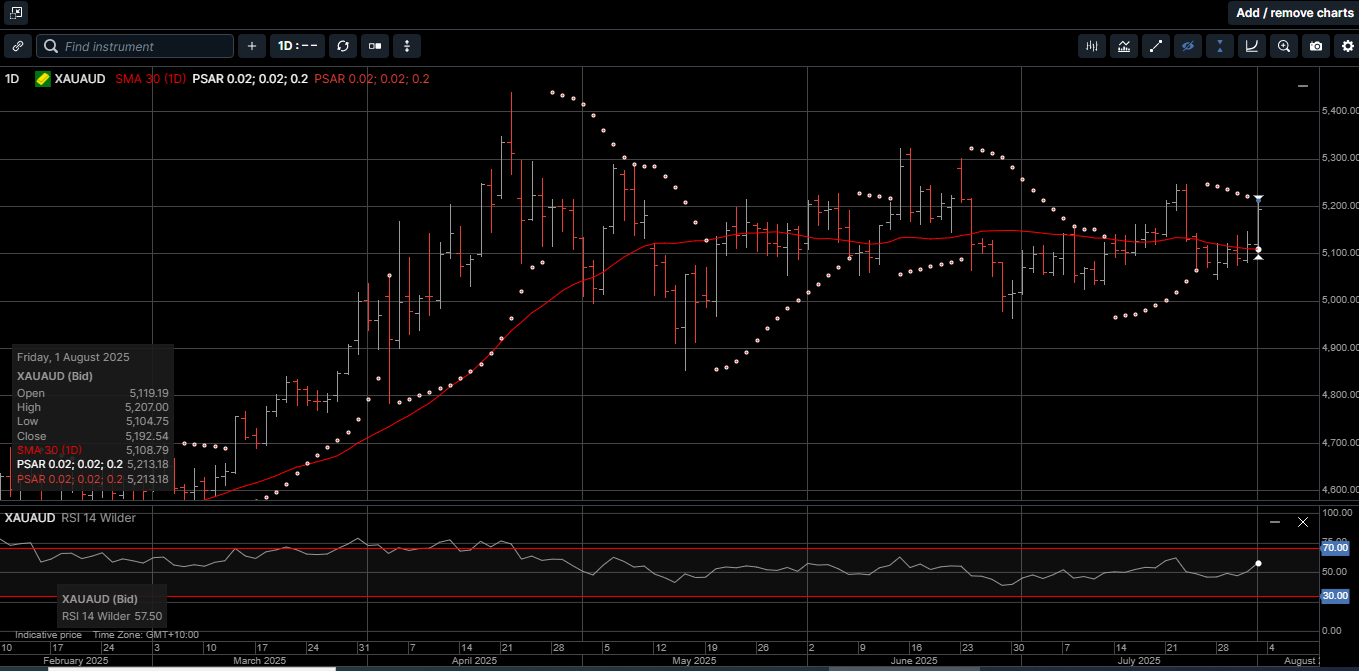
Gold denominated in AUD posted a 2.0% gain on Friday and finished the week 2.3% higher at $5192.00.
After testing lower price levels, physical Gold priced in both currencies closed the week above their respective 30-day moving averages, which improves the bullish technical tone going forward.
Silver priced in USD fell to a three-week low at $36.20 before paring some losses on Friday to close the week 3.0% lower at $37.05, which is the first weekly close below the 30-day moving average since May 2nd.
Silver based in AUD slipped 1.6% lower to close at $57.20, which is still above the 30-day moving average at $57.15.
The Gold versus Silver ratio rose 3.9% in favor of Gold to close at 90.75. This means it takes 90.73 ounces of Silver to equal the price of one ounce of Gold.
Physical Platinum prices hit a six-week low at $1270.00 and finished the week 7.2% lower at $1330.00. Considering Platinum prices have rallied over 40% during the last six months, a few weeks of price consolidation before moving higher could be expected.
So, how bad was last Friday’s US NFP report? In terms of the US employment outlook, it was very bad.
The headline new jobs number printed at 73,000 versus a consensus forecast of 110,000.
However, it was the revisions of the previous monthly numbers that really pushed the USD and interest rates lower and drove the hard asset prices higher.
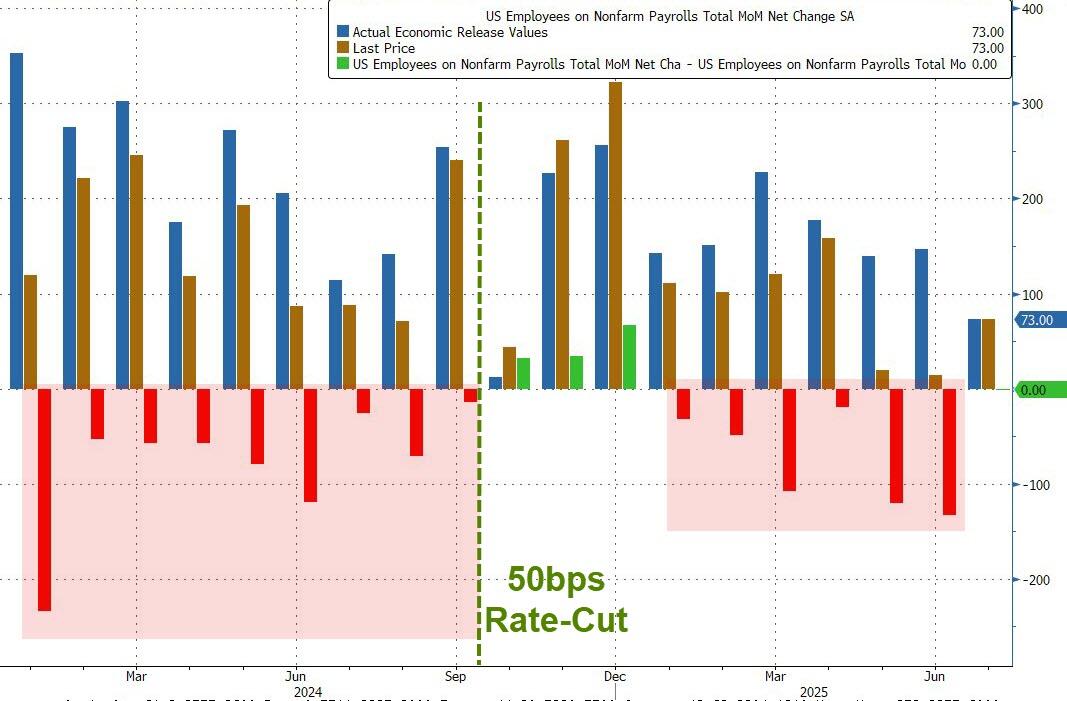
As shown on Chart 2, the number of new jobs has been revised lower by more than 250,000 over the last two months.
Chart 2: Payroll Revisions
And even worse on a broader time scale, 15 of the last 18 NFP reports have seen the original headline jobs numbers revised lower.
After a period of resilient US job growth, Friday’s data now point to unmistakable signs of cooling.
Whether it is a modest uptick in unemployment, waning wage gains, or softening job openings, the indicators collectively suggest the US labor market is losing momentum.
In short, the labor market, once the anchor for US growth, now looks vulnerable to a deeper cyclical correction.
From a knock-on perspective, the weakness of the jobs data likely signals the end of the month-long USD bounce and gives Gold, Silver and Platinum another pillar of support from a weaker USD.
The USD’s rally in July was predicated on a rise in US rates and economic data that proved more resilient than expected
That ended dramatically with the disappointing jobs report.
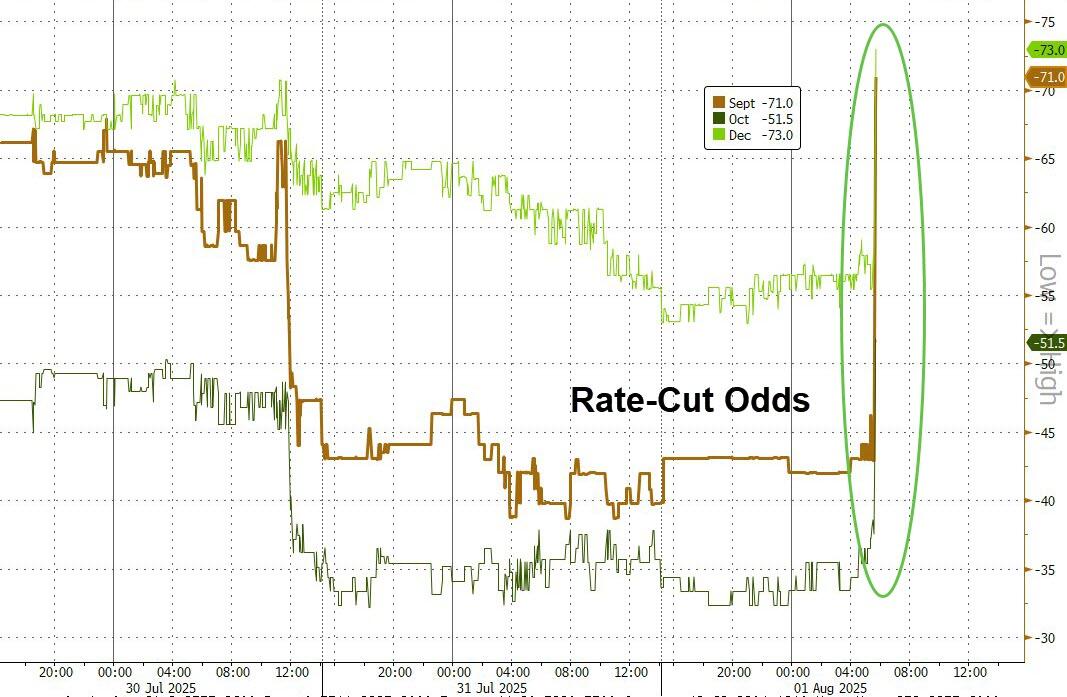
As s hown on Chart 3, the odds of a rate cut at the September FOMC meeting jumped from 42% to almost 75% during last Friday’s trading session.
Chart 3: Rate Cut Odds
That is an extremely large move in the predictive interest rate market and is indicative of the growing uncertainty across traditional asset classes.
As such, investors should prepare themselves for turbulence, not just in commodities and currencies but in the very assumptions of owning a large percentage of paper assets.
In this uncertain economic environment, it’s likely that markets will reward those who stay vigilant, provident, and unsentimental about old certainties.
What is certain is that physical Gold, Silver and Platinum will continue to represent a time-proven and secure store of value for investors looking to create and preserve wealth over a long-term time horizon.
This recent pullback in precious metals prices is a perfect opportunity for investors to consider adding to their hard asset holdings within a diversified portfolio.
Chart 4: Gold AUD
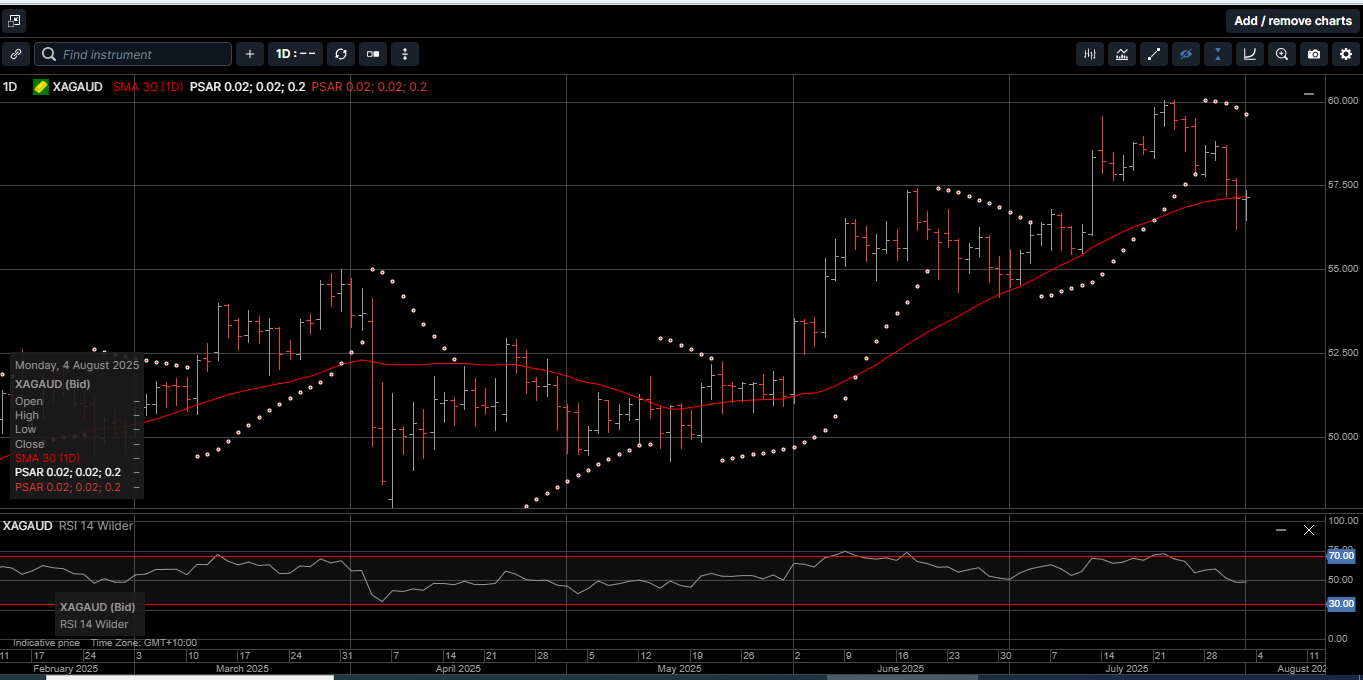
Chart 5: Silver AUD
This publication has been prepared for the GBA Group Companies. It is for education purposes only and should not be considered either general of personal advice. It does not consider any particular person’s investment objectives, financial situation or needs. Accordingly, no recommendation (expressed or implied) or other information contained in this report should be acted upon without the appropriateness of that information having regard to those factors. You should assess whether or not the information contained herein is appropriate to your individual financial circumstances and goals before making an investment decision, or seek the help the of a licensed financial adviser. Performance is historical, performance may vary, past performance is not necessarily indicative of future performance. Any prices, quotes or statistics included have been obtained from sources deemed to be reliable, but we do not guarantee their accuracy or completeness.