The Accumulation Phase for Gold and Silver
The Accumulation Phase for Gold and Silver
After posting double-digit gains during the first half of the year, it was reasonable to expect some price consolidation in the Gold and Silver markets.
And while this has largely been the case, it is important to note that uncertainty about US trade policy, growing global sovereign debt and simmering geopolitical tensions continue to underpin the long-term uptrends in the precious metals complex.
Physical Gold priced in USD held the accelerated trendline above $3250.00 and reached a three-week high of $3368.00 before closing out the week fractionally higher at $3355.00.
Gold denominated in AUD traded in a tight range below its 30-Day moving average at $5135.00 and finished the week unchanged from the previous week at $5098.00.
Physical Silver outperformed Gold by a wide margin last week and demonstrated why the grey metal is viewed as both a critical monetary asset and an important industrial commodity.
Silver priced in USD reached a 14-year high at $38.55 and closed 4.1% higher at $38.40.
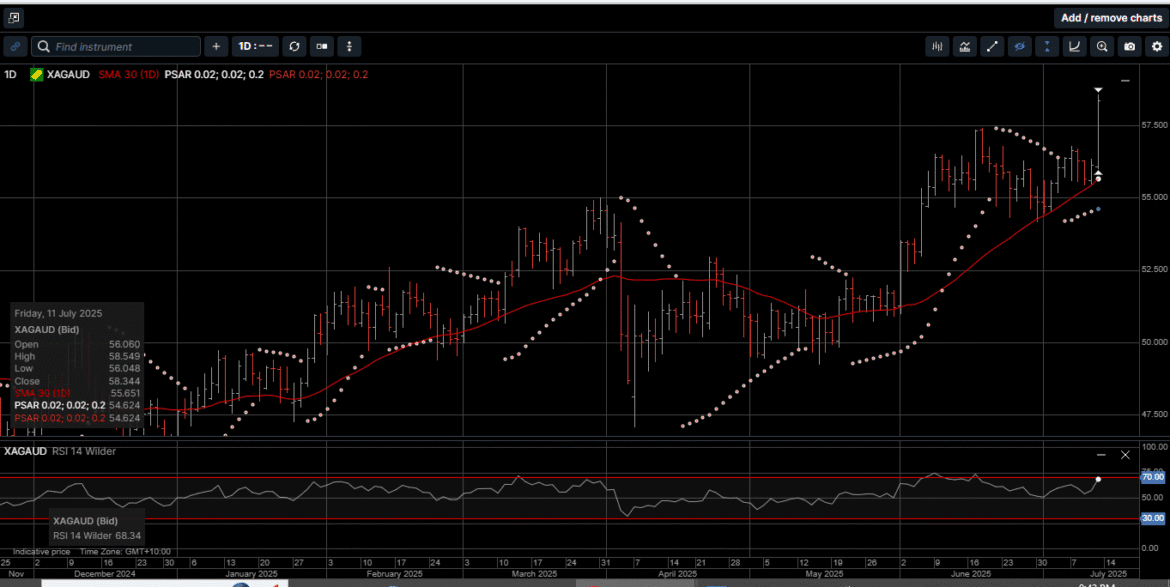
Silver based in AUD posted a new all-time high at $58.50, eclipsing the June 18th all-time high of $57.40 by more than 1.6%. AUD Silver closed the week 3.5% higher at $58.35.
And while internal momentum indicators for Silver based in both currencies are elevated on the daily charts, they are not in overbought territory, which suggests more near-term price extension.
As illustrated on Chart 1, the Gold versus Silver ratio reached a four-month low at 87.05 in favor of Silver. This means it takes 87.05 ounces of Silver to equal the price of one ounce of Gold.
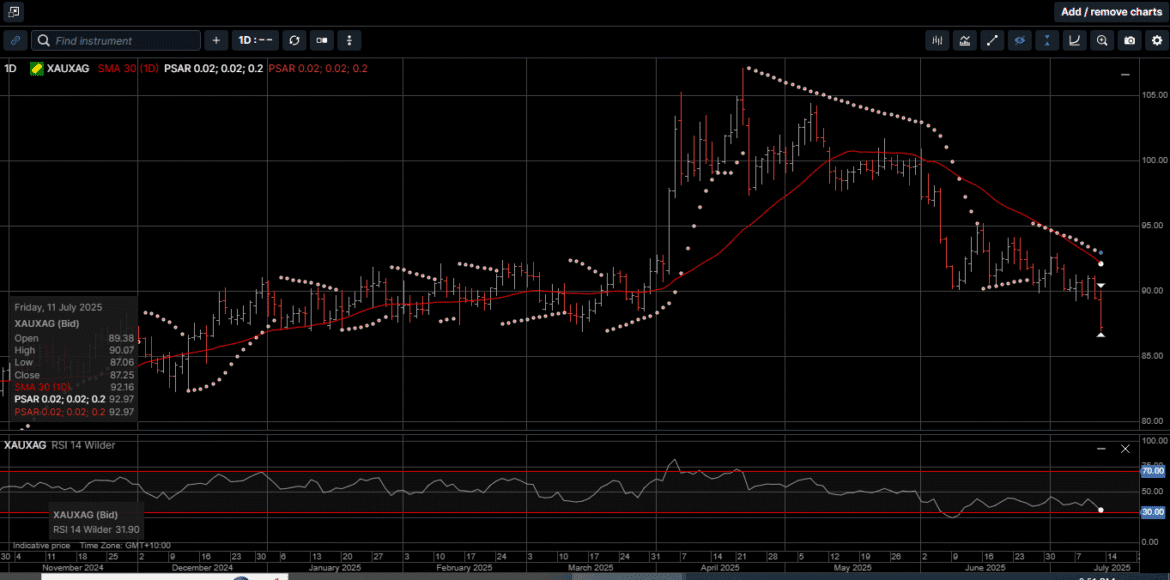
Since the ratio hit a high of 107.00 on April 22nd, physical Silver has outperformed Gold on a relative price basis by 18.6%.
After stellar first-half performances from Gold and Silver, some market commentators are wondering if the precious metals have topped out for 2025.
It is our view that the factors that drove Gold and Silver to the current price levels remain intact, and additional drivers look likely to kick in throughout the second half of the year.
Most significantly, the prospect of lower US interest rates could reignite demand by reducing the opportunity cost of holding non-yielding assets like precious metals.
As shown on Chart 2, over the last 17 years, the US FED Funds rate traded near zero for over seven years and had a mid-point rate at just over 2.0%.
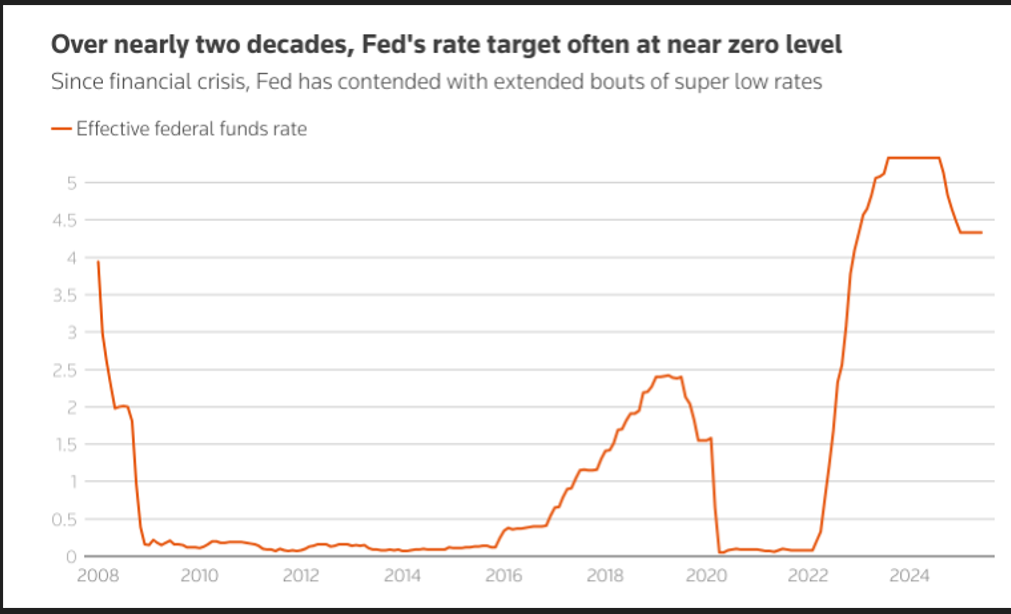
At the current target rate of 4.25% to 4.50%, the FED could lower the FED Funds rate by 225 basis points to reach the notional neutral rate relative to the 2008 level.
The likely knock-on effect of the FED Funds rates sloping lower over the next several quarters would be an extension of the downtrend in the USD, which, as measured by the USD Index is 10.3% lower year-to-date.
The pressure on the US FED to lower rates has increased in recent weeks. One of the main planks of the pressure is that lower rates will reduce the cost of servicing the US debt.
As shown on Chart 3, the cost for the US to borrow has doubled over the last five years and is approaching $1 trillion per year.
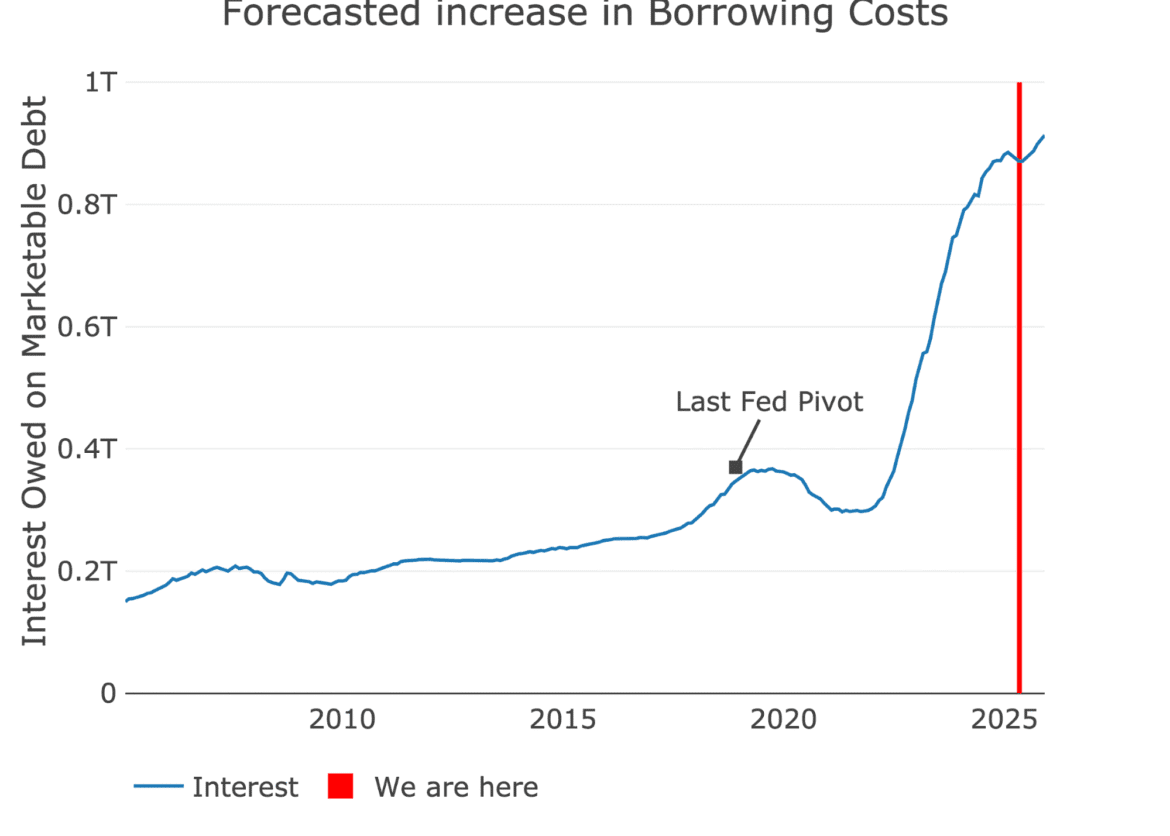
The magnitude of these debt servicing numbers combined with the other drivers mentioned above could continue to act as a tailwind for precious metals prices.
Physical Gold and Silver are universally recognized as a store of value, not tied to the creditworthiness of any nation, which is why institutions as well as private investors are increasingly accumulating Gold and Silver as core assets.
Over the last six months, market participants have endured extreme price swings across many asset classes.
Blue chip energy stocks plummeted on trade fears, only to spike after Middle East tensions flared, G-10 Government Bonds have whipsawed as Wall Street Tech stocks stumbled quickly and recovered slowly.
And through it all, Gold and Silver prices steadily continued to build upside momentum.
Physical Gold and Silver have both returned over 25% year-to-date because they’re tangible, secure of counterparty risk and represent a time proven store of value
Gold and Silver offer protection and long-term security against the political and financial risks now impacting a wide array of traditional assets.
Now is the time to consider reviewing underperforming paper assets and accumulating more precious metals as part of a diversified wealth creation strategy.
Chart 4 Gold AUD
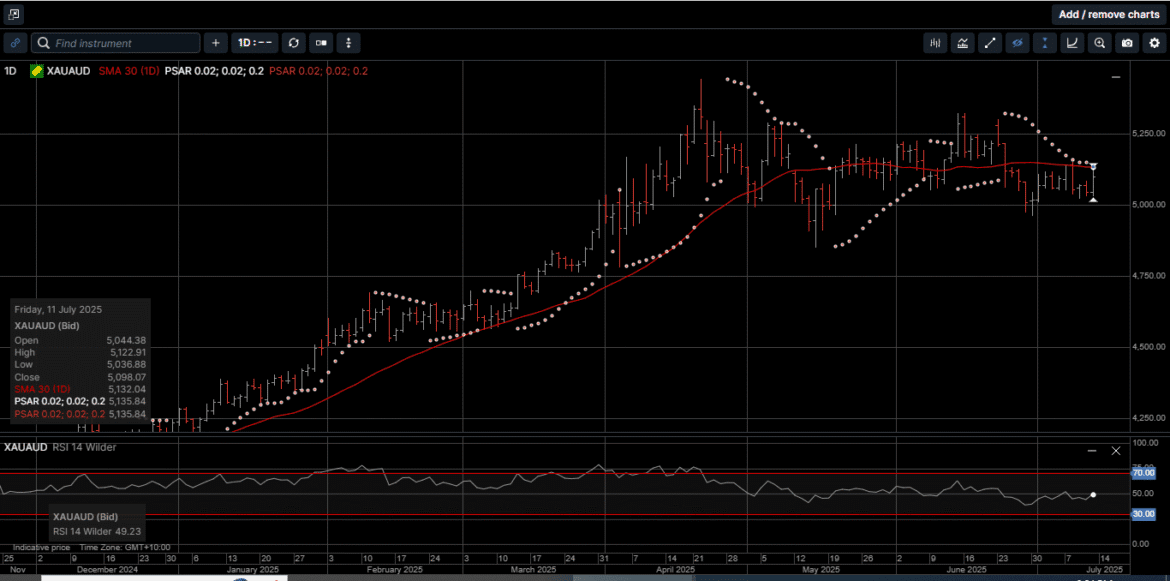
Chart 5 Silver AUD
This publication has been prepared for the GBA Group Companies. It is for education purposes only and should not be considered either general of personal advice. It does not consider any particular person’s investment objectives, financial situation or needs. Accordingly, no recommendation (expressed or implied) or other information contained in this report should be acted upon without the appropriateness of that information having regard to those factors. You should assess whether or not the information contained herein is appropriate to your individual financial circumstances and goals before making an investment decision, or seek the help the of a licensed financial adviser. Performance is historical, performance may vary, past performance is not necessarily indicative of future performance. Any prices, quotes or statistics included have been obtained from sources deemed to be reliable, but we do not guarantee their accuracy or completeness.