US Strikes Iranian Nuclear Sites
US Strikes Iranian Nuclear Sites
The question about whether the US would engage militarily with Iran has been answered.
Late Saturday night, New York time, the US administration deployed six B-2 bombers to deliver between six and 12 ground penetrating bombs at Iranian nuclear sites in Fordow, Natanz and Esfahan.
These initial strikes were followed by 30 Tomahawk cruise missiles launched from Ohio class submarines to the same targets.
At this time, the bomb damage assessment and any measures of radioactive fallout have not been verified.
Over the last several months, uncertainty about reciprocal tariffs, sovereign interest rate policies and geopolitical tensions have cast a long shadow over global financial markets.
We expect the combination of these fundamental uncertainties will continue to draw central banks, institutions and private investors into the secure safe haven of physical Gold and Silver.
Gold priced in USD tagged a two-month high of $3451.00 last Monday before sliding lower to close the week with a 1.8% loss at $3368.00.
Despite the softer tone in the tail end of the week, USD Gold has closed above the 30-day moving average the last 12 consecutive sessions to maintain a bullish technical posture.
Gold denominated in AUD slipped 1.2% lower to close at $5217.00.
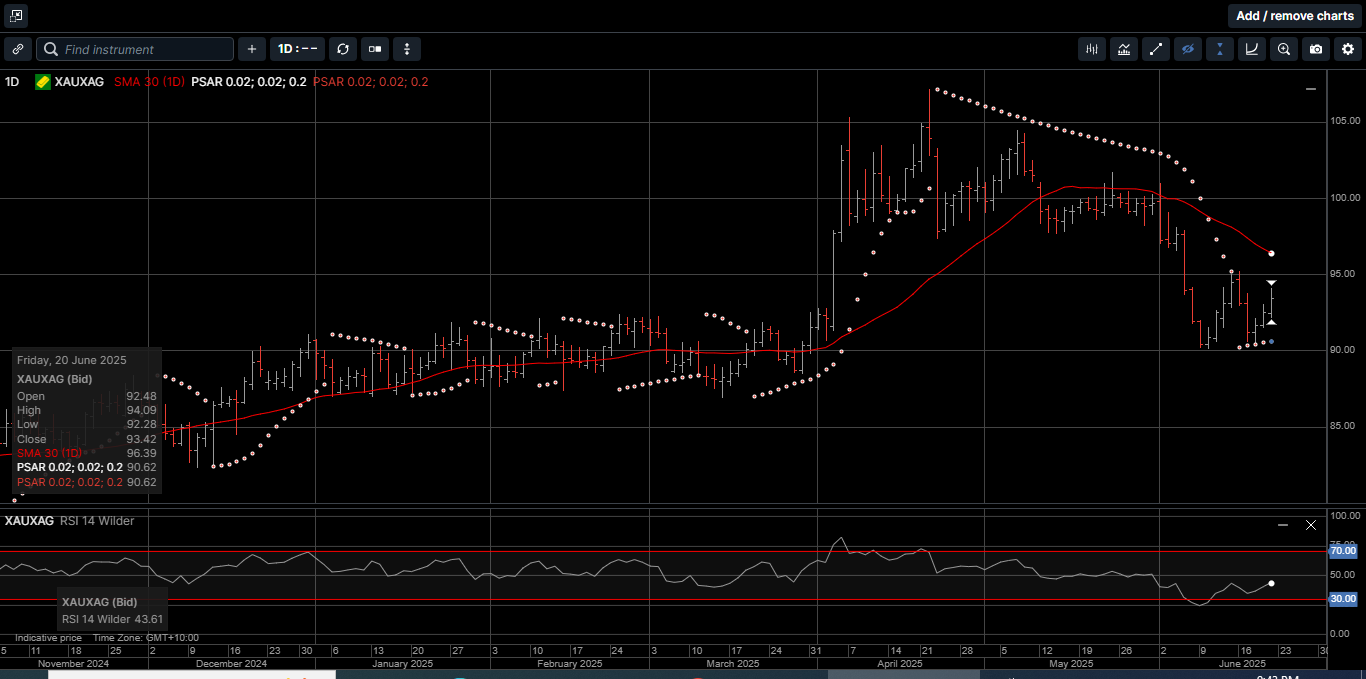
Physical Silver priced in USD reached a 14-year high at $37.35 but was unable to extend higher and closed fractionally lower for the week at $36.05.
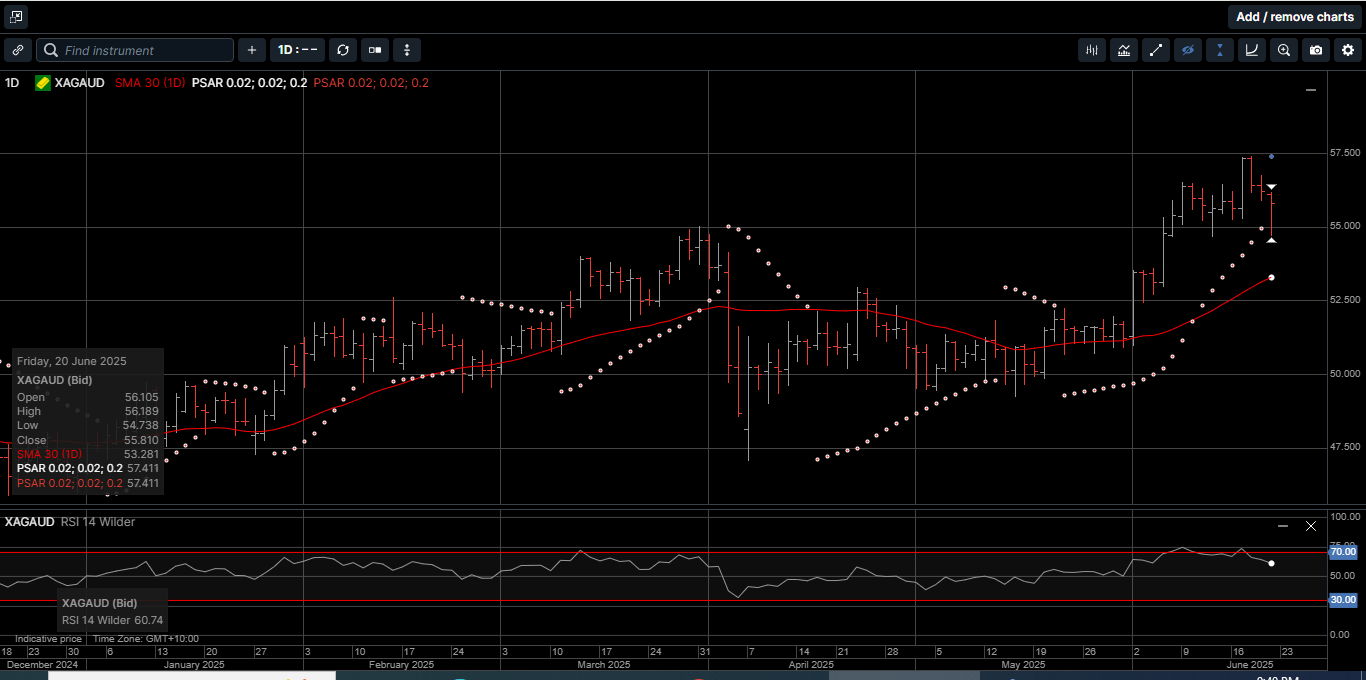
AUD-based Silver posted a new all-time at $57.40 last Wednesday but reversed lower into the weekend to close pretty much unchanged at $55.80.
Physical Silver, price in both USD and AUD have not posted a daily close below the 30-day moving average since May 20th, which forms a very bullish chart pattern.
The Gold versus Silver ratio traded in a relatively narrow range last week and closed 1.1% in favor of Silver at 93.40. This means it takes 93.40 ounce of Silver to equal the price of one ounce of Gold.
As illustrated on Chart 1, on April 22nd this ratio traded at 107.10, which means that Silver has outperformed Gold by 12.8% over the last month.
The major event driving the precious metals complex last week was the US Federal Reserve’s FOMC meeting.
The FED held rates flat as expected, amid growing fear of stagflation largely due to the unpredictable impact of US tariffs on domestic prices.
The FED did not shift its view of (median) rate-cut expectations for 2025 despite calling for higher unemployment, higher inflation, and weaker growth.
However, the distribution of future rate cuts for 2025 shifted hawkishly, with seven policy members seeing no cuts in 2025, up from 4 members at the May 7th FOMC meeting.
Since the May FOMC meeting a great deal has happened both macro-economically and geopolitically.
Global trade policy uncertainty has tumbled but as shown on Chart 2, geopolitical uncertainty has soared.
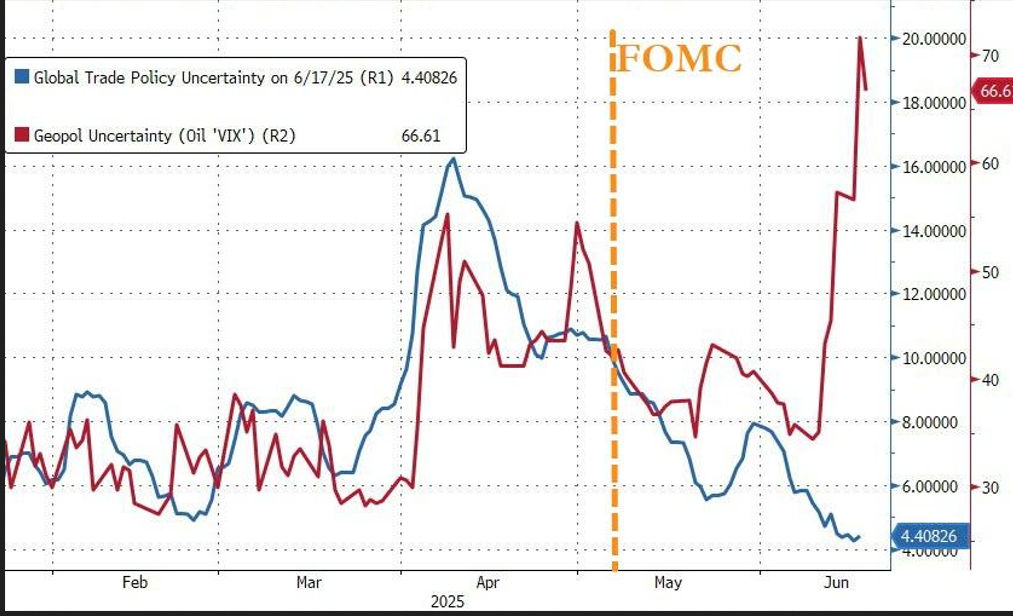
This has sent crude oil prices soaring as the dollar and bonds lost ground. Gold is flat while stocks are up significantly.|
But, rate-cut expectations for 2025 have tumbled since the last FOMC meeting (though 2026 expectations are up modestly)
The lack of a clear interest rate easing pathway from the FED is the main reason why Gold and Silver drifted lower during the back end of last week.
Further, as shown on Chart 3, the last time US economic data was as weak as it is now, the FED cut rates by 50 basis points from 5.5% to 5.0%.
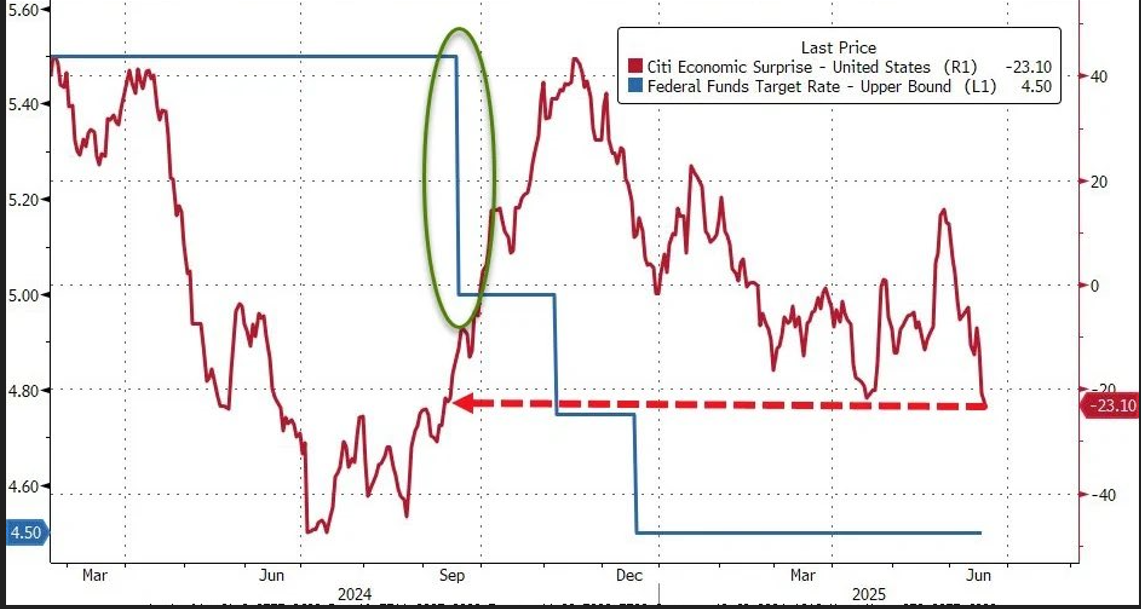
With the US now directly involved militarily in the growing conflict in the Middle East, it’s difficult to say exactly what the FED will be looking at during their July meeting to determine whether to hold rates again or cut.
What is clear is that physical Gold and Silver will continue to represent a time-proven and secure store of value for investors looking to create and preserve wealth over a long-term time horizon.
This recent pullback in Gold and Silver prices is a perfect opportunity for provident investors to consider adding to their hard asset holdings within a diversified portfolio.
Chart 4 Gold AUD
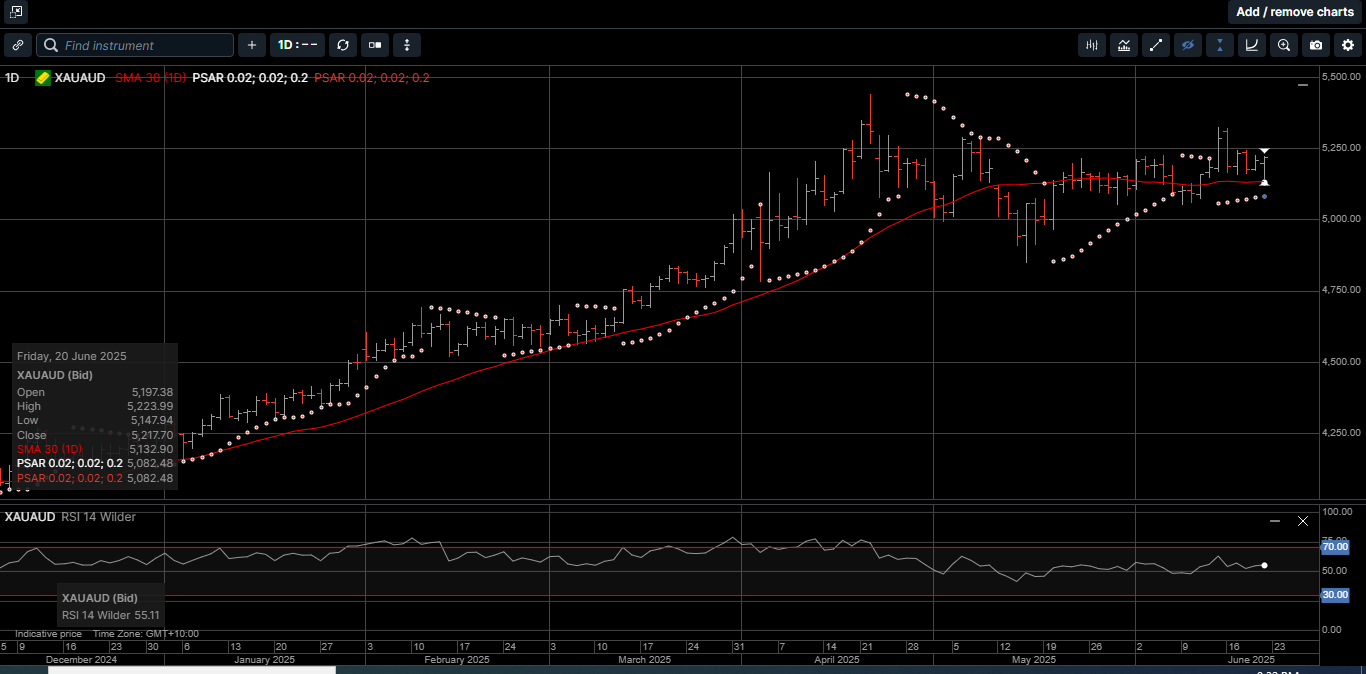
Chart 5 Silver AUD
This publication has been prepared for the GBA Group Companies. It is for education purposes only and should not be considered either general of personal advice. It does not consider any particular person’s investment objectives, financial situation or needs. Accordingly, no recommendation (expressed or implied) or other information contained in this report should be acted upon without the appropriateness of that information having regard to those factors. You should assess whether or not the information contained herein is appropriate to your individual financial circumstances and goals before making an investment decision, or seek the help the of a licensed financial adviser. Performance is historical, performance may vary, past performance is not necessarily indicative of future performance. Any prices, quotes or statistics included have been obtained from sources deemed to be reliable, but we do not guarantee their accuracy or completeness.